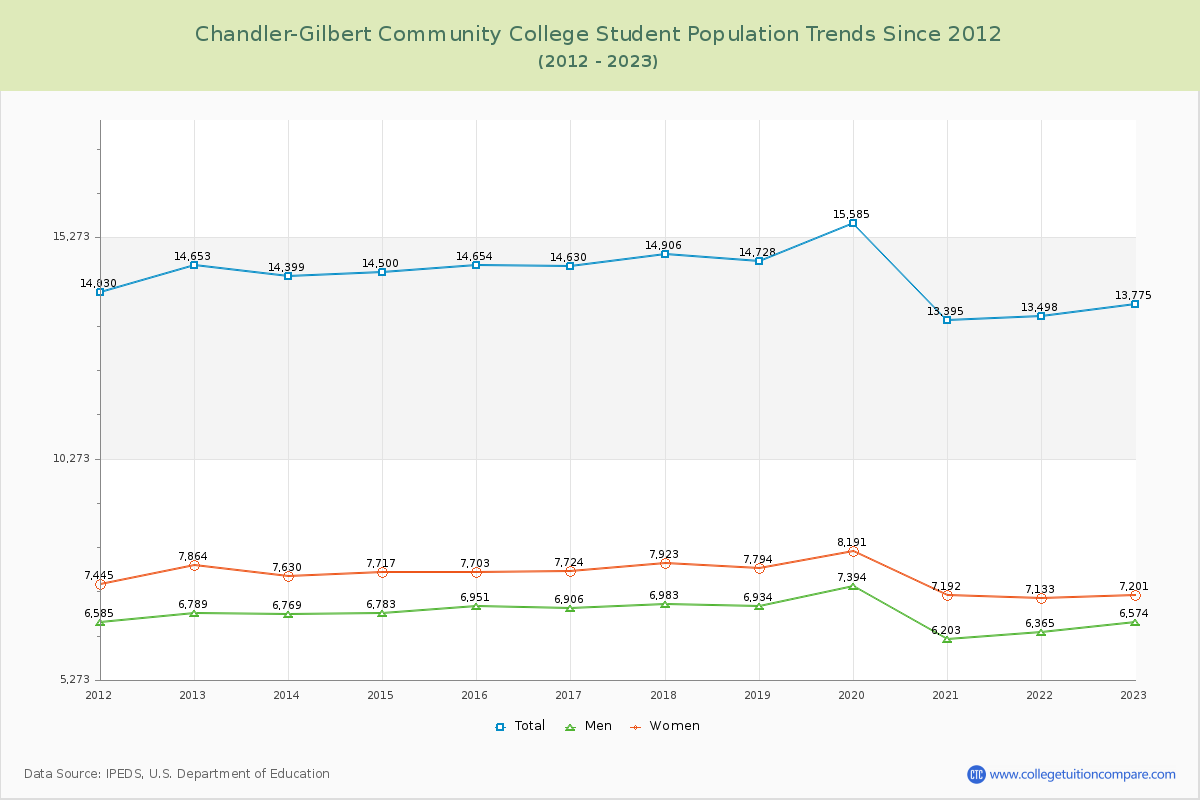
Student Population Changes
The average student population over the last 12 years is 14,429 where 13,775 students are attending the school for the academic year 2022-2023.
The female to male ratio is 1.10 to 1 and it means that there are similar numbers of female and male students enrolled in Chandler-Gilbert CC.
The following table and chart illustrate the changes in student population by gender at Chandler-Gilbert Community College since 2012.
| Year | Total | Men | Women |
|---|---|---|---|
| 2012-13 | 14,653 | 6,789 | 7,864 |
| 2013-14 | 14,399 -254 | 6,769 -20 | 7,630 -234 |
| 2014-15 | 14,500 101 | 6,783 14 | 7,717 87 |
| 2015-16 | 14,654 154 | 6,951 168 | 7,703 -14 |
| 2016-17 | 14,630 -24 | 6,906 -45 | 7,724 21 |
| 2017-18 | 14,906 276 | 6,983 77 | 7,923 199 |
| 2018-19 | 14,728 -178 | 6,934 -49 | 7,794 -129 |
| 2019-20 | 15,585 857 | 7,394 460 | 8,191 397 |
| 2020-21 | 13,395 -2,190 | 6,203 -1,191 | 7,192 -999 |
| 2021-22 | 13,498 103 | 6,365 162 | 7,133 -59 |
| 2022-23 | 13,775 277 | 6,574 209 | 7,201 68 |
| Average | 14,429 | 6,786 | 7,643 |