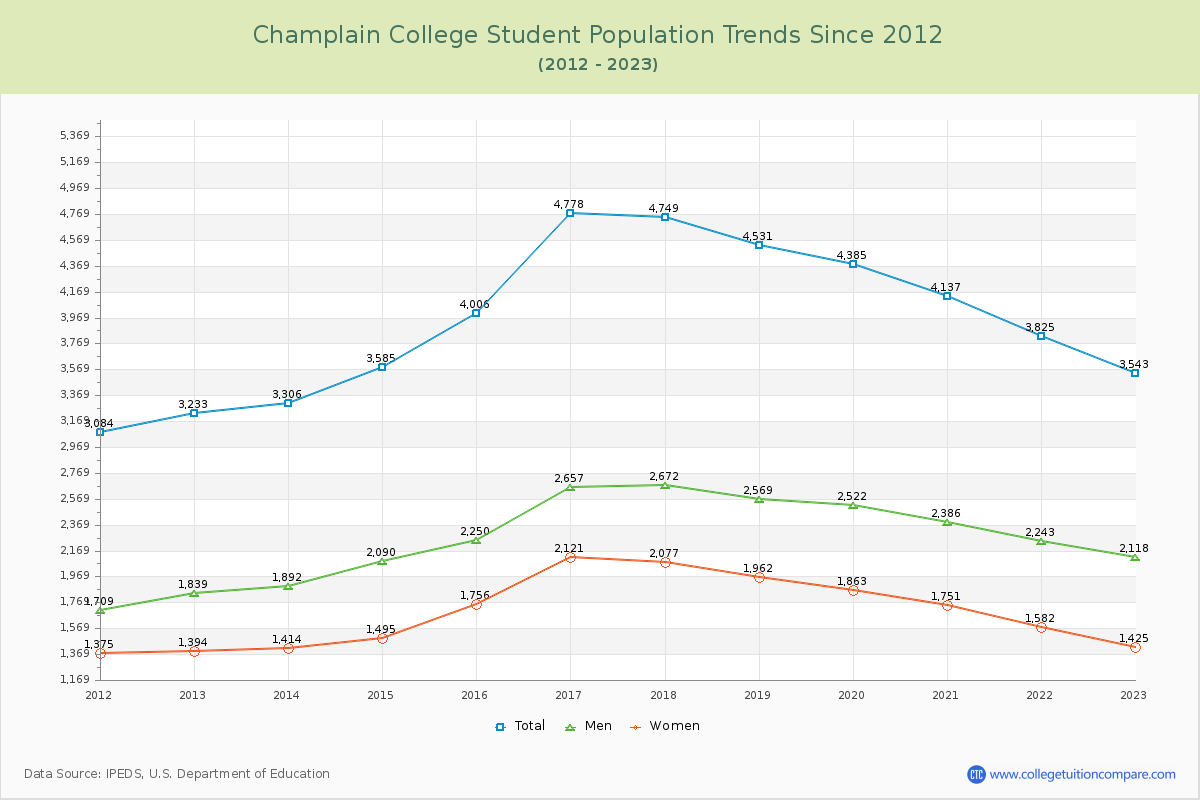
Student Population Changes
The average student population over the last 12 years is 4,007 where 3,543 students are attending the school for the academic year 2022-2023.
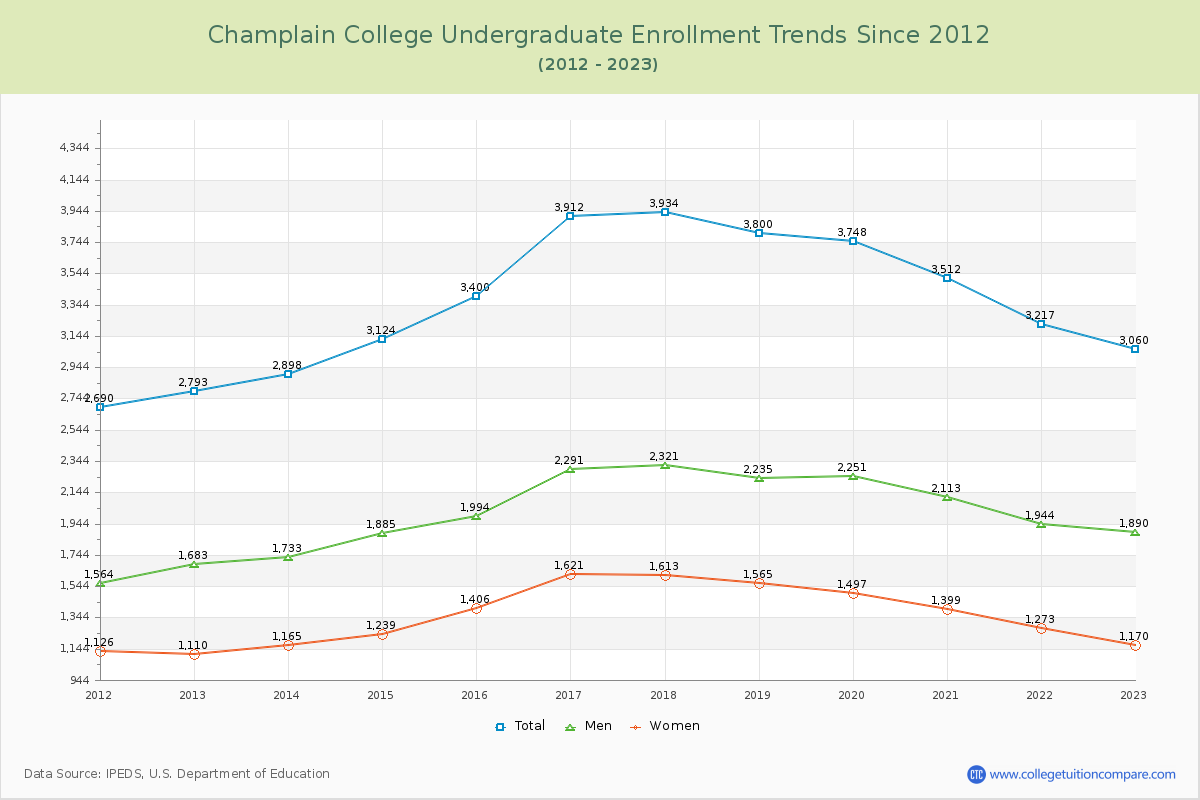
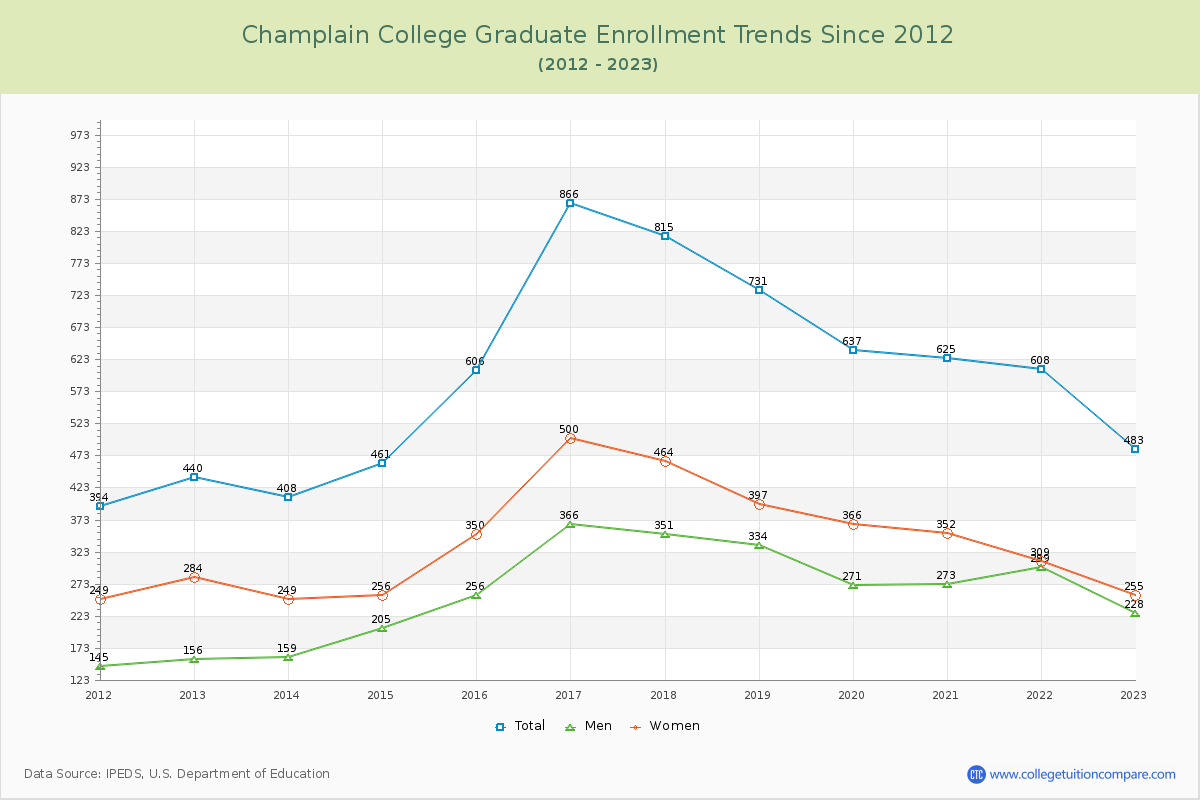
86.37% of total students is undergraduate students and 13.63% students is graduate students. The number of undergraduate students has increased by 267 and the graduate enrollment has increased by 43 over past 10 years.
The female to male ratio is 0.67 to 1 and it means that there are more male students enrolled in Champlain than female students.
The following table and chart illustrate the changes in student population by gender at Champlain College since 2012.
| Year | Total | Undergraduate | Graduate | ||||
|---|---|---|---|---|---|---|---|
| Total | Men | Women | Total | Men | Women | ||
| 2012-13 | 3,233 | 2,793 | 1,683 | 1,110 | 440 | 156 | 284 |
| 2013-14 | 3,306 73 | 2,898 105 | 1,733 50 | 1,165 55 | 408 -32 | 159 3 | 249 -35 |
| 2014-15 | 3,585 279 | 3,124 226 | 1,885 152 | 1,239 74 | 461 53 | 205 46 | 256 7 |
| 2015-16 | 4,006 421 | 3,400 276 | 1,994 109 | 1,406 167 | 606 145 | 256 51 | 350 94 |
| 2016-17 | 4,778 772 | 3,912 512 | 2,291 297 | 1,621 215 | 866 260 | 366 110 | 500 150 |
| 2017-18 | 4,749 -29 | 3,934 22 | 2,321 30 | 1,613 -8 | 815 -51 | 351 -15 | 464 -36 |
| 2018-19 | 4,531 -218 | 3,800 -134 | 2,235 -86 | 1,565 -48 | 731 -84 | 334 -17 | 397 -67 |
| 2019-20 | 4,385 -146 | 3,748 -52 | 2,251 16 | 1,497 -68 | 637 -94 | 271 -63 | 366 -31 |
| 2020-21 | 4,137 -248 | 3,512 -236 | 2,113 -138 | 1,399 -98 | 625 -12 | 273 2 | 352 -14 |
| 2021-22 | 3,825 -312 | 3,217 -295 | 1,944 -169 | 1,273 -126 | 608 -17 | 299 26 | 309 -43 |
| 2022-23 | 3,543 -282 | 3,060 -157 | 1,890 -54 | 1,170 -103 | 483 -125 | 228 -71 | 255 -54 |
| Average | 4,007 | 3,400 | 2,031 | 1,369 | 607 | 263 | 344 |