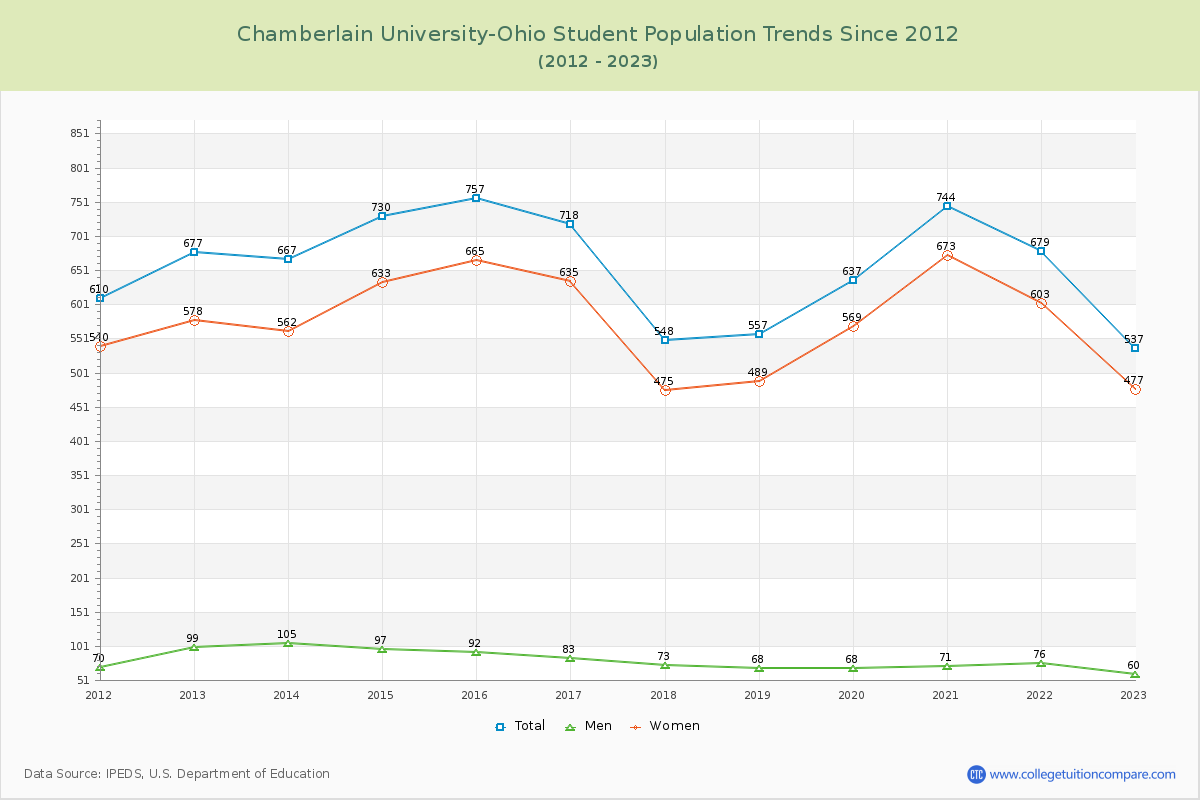
Student Population Changes
The average student population over the last 12 years is 659 where 537 students are attending the school for the academic year 2022-2023.
The female to male ratio is 7.95 to 1 and it means that there are far more female students enrolled in Chamberlain University-Ohio than male students.
The following table and chart illustrate the changes in student population by gender at Chamberlain University-Ohio since 2012.
| Year | Total | Men | Women |
|---|---|---|---|
| 2012-13 | 677 | 99 | 578 |
| 2013-14 | 667 -10 | 105 6 | 562 -16 |
| 2014-15 | 730 63 | 97 -8 | 633 71 |
| 2015-16 | 757 27 | 92 -5 | 665 32 |
| 2016-17 | 718 -39 | 83 -9 | 635 -30 |
| 2017-18 | 548 -170 | 73 -10 | 475 -160 |
| 2018-19 | 557 9 | 68 -5 | 489 14 |
| 2019-20 | 637 80 | 68 0 | 569 80 |
| 2020-21 | 744 107 | 71 3 | 673 104 |
| 2021-22 | 679 -65 | 76 5 | 603 -70 |
| 2022-23 | 537 -142 | 60 -16 | 477 -126 |
| Average | 659 | 81 | 578 |