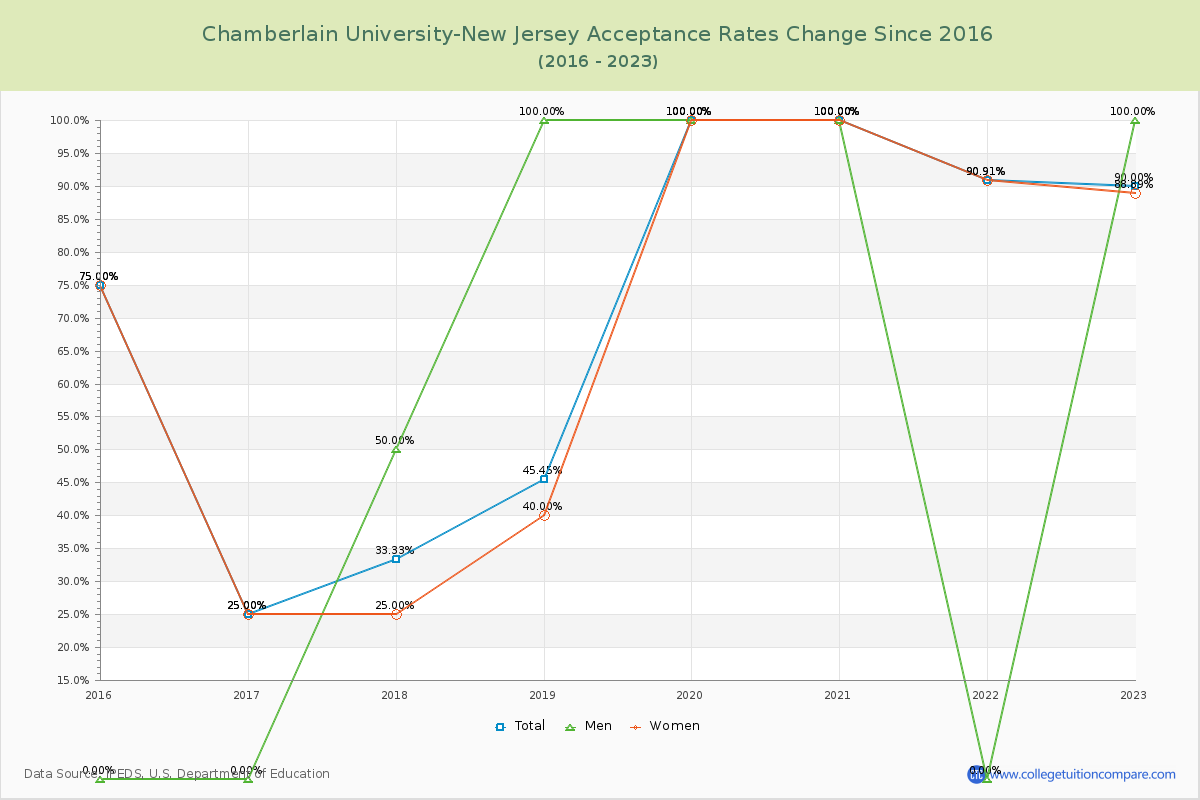
Acceptance Rate Changes
The average acceptance rate over the last 10 years is 69.96%, and this year's acceptance rate is 90.00% at Chamberlain University-New Jersey. By gender, men students' acceptance rate is 56.25% and women students' rate is 68.10%.
The next table and chart illustrate the acceptance rates changes at Chamberlain University-New Jersey over the past 8 years (2015-2023).
| Year | Total | Men | Women |
|---|---|---|---|
| 2015-16 | 75.00% | 0.00% | 75.00% |
| 2016-17 | 25.00% -50.00% |
0.00% -50.00% |
25.00% -50.00% |
| 2017-18 | 33.33% 8.33% |
50.00% 0.00% |
25.00% 0.00% |
| 2018-19 | 45.45% 12.12% |
100.00% 15.00% |
40.00% 15.00% |
| 2019-20 | 100.00% 54.55% |
100.00% 60.00% |
100.00% 60.00% |
| 2020-21 | 100.00% 0.00% |
100.00% 0.00% |
100.00% 0.00% |
| 2021-22 | 90.91% -9.09% |
0.00% -9.09% |
90.91% -9.09% |
| 2022-23 | 90.00% -0.91% |
100.00% -2.02% |
88.89% -2.02% |
| Average | 69.96% | 56.25% | 68.10% |