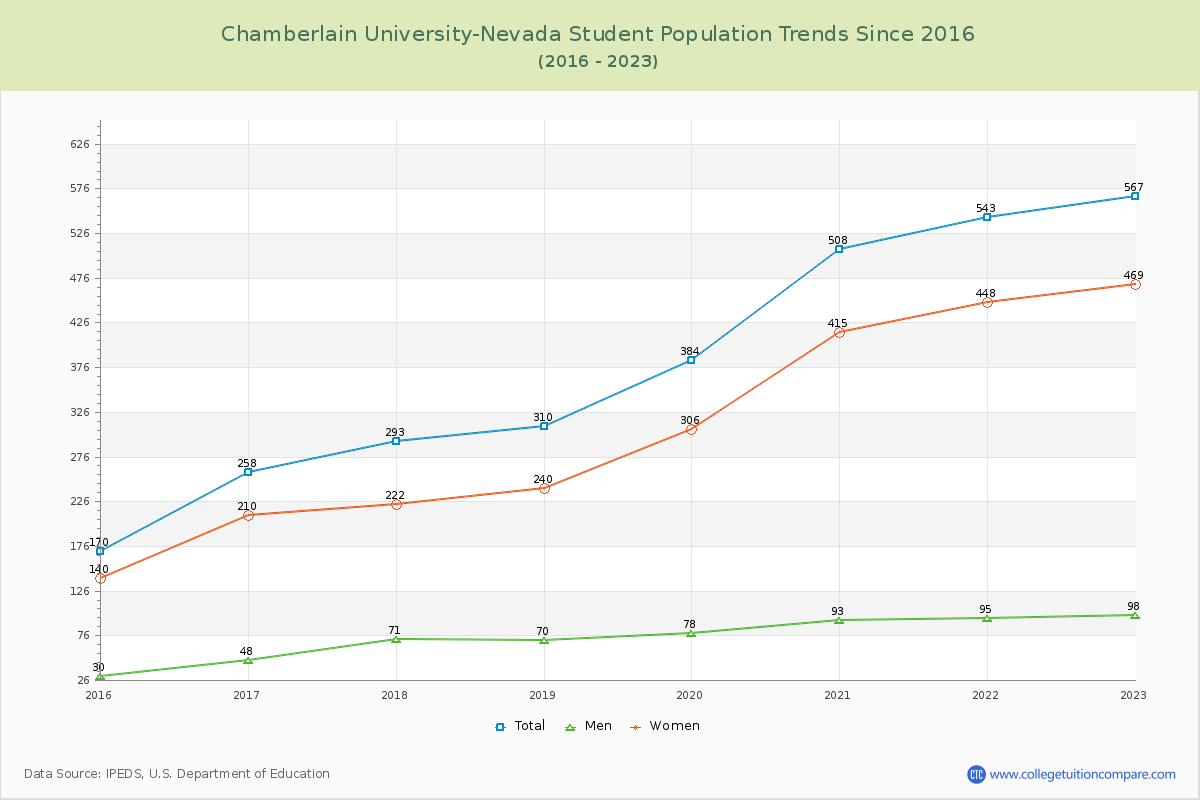
Student Population Changes
The average student population over the last 9 years is 379 where 567 students are attending the school for the academic year 2022-2023.
The female to male ratio is 4.79 to 1 and it means that there are far more female students enrolled in Chamberlain University-Nevada than male students.
The following table and chart illustrate the changes in student population by gender at Chamberlain University-Nevada since 2015.
| Year | Total | Men | Women |
|---|---|---|---|
| 2015-16 | 170 | 30 | 140 |
| 2016-17 | 258 88 | 48 18 | 210 70 |
| 2017-18 | 293 35 | 71 23 | 222 12 |
| 2018-19 | 310 17 | 70 -1 | 240 18 |
| 2019-20 | 384 74 | 78 8 | 306 66 |
| 2020-21 | 508 124 | 93 15 | 415 109 |
| 2021-22 | 543 35 | 95 2 | 448 33 |
| 2022-23 | 567 24 | 98 3 | 469 21 |
| Average | 379 | 73 | 306 |