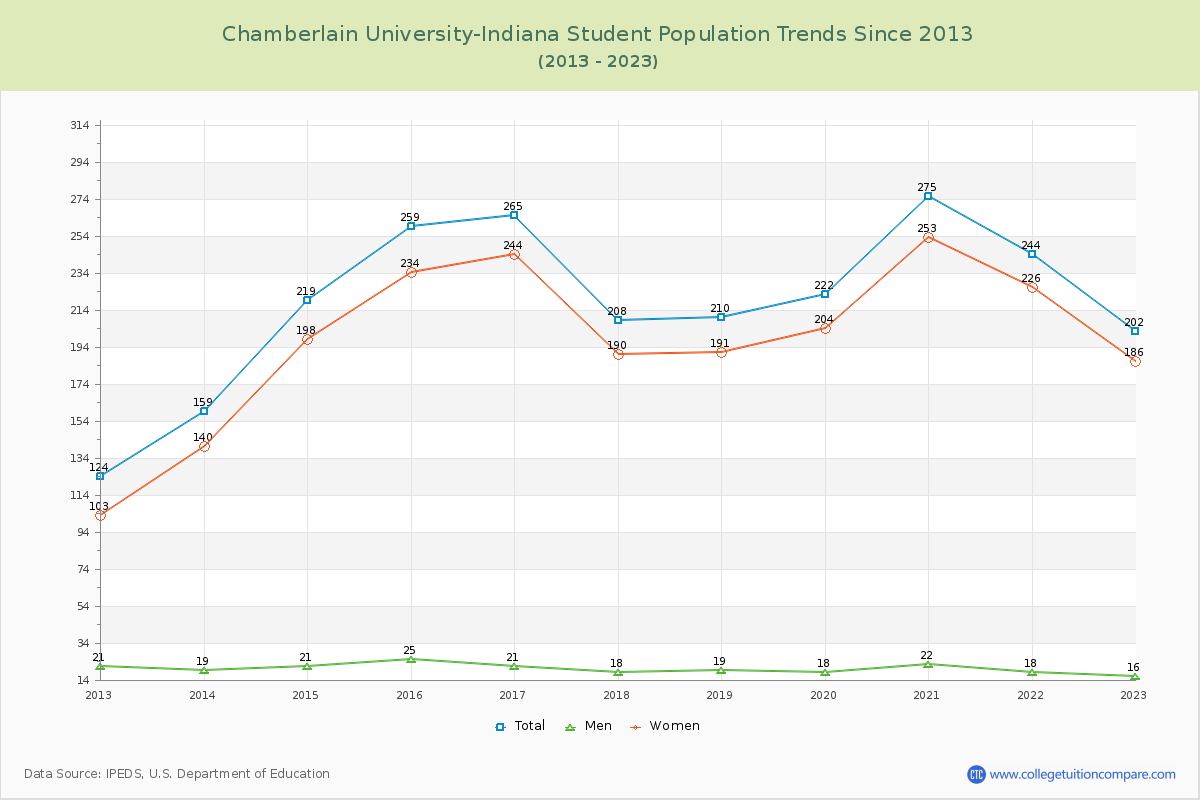
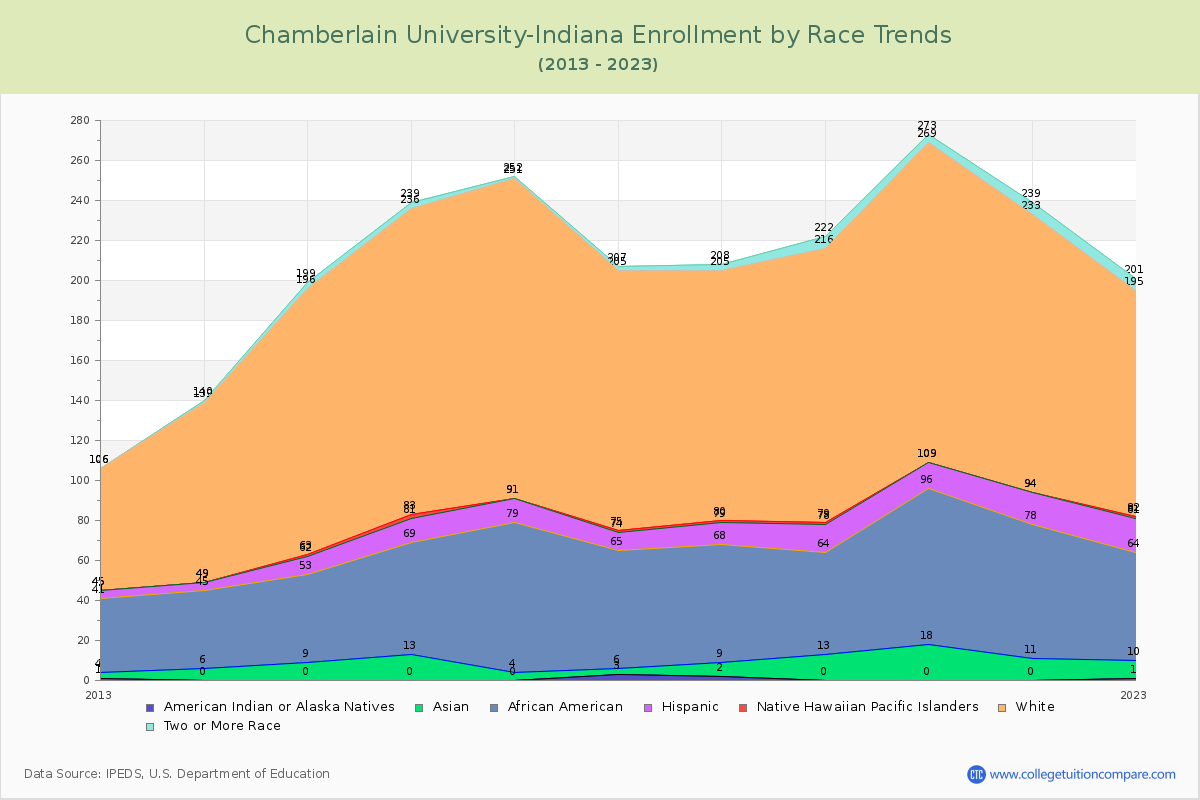
Student Population Changes
The average student population over the last 12 years is 217 where 202 students are attending the school for the academic year 2022-2023.
The female to male ratio is 11.63 to 1 and it means that there are far more female students enrolled in Chamberlain University-Indiana than male students.
The following table and chart illustrate the changes in student population by gender at Chamberlain University-Indiana since 2012.
| Year | Total | Men | Women |
|---|---|---|---|
| 2012-13 | 124 | 21 | 103 |
| 2013-14 | 159 35 | 19 -2 | 140 37 |
| 2014-15 | 219 60 | 21 2 | 198 58 |
| 2015-16 | 259 40 | 25 4 | 234 36 |
| 2016-17 | 265 6 | 21 -4 | 244 10 |
| 2017-18 | 208 -57 | 18 -3 | 190 -54 |
| 2018-19 | 210 2 | 19 1 | 191 1 |
| 2019-20 | 222 12 | 18 -1 | 204 13 |
| 2020-21 | 275 53 | 22 4 | 253 49 |
| 2021-22 | 244 -31 | 18 -4 | 226 -27 |
| 2022-23 | 202 -42 | 16 -2 | 186 -40 |
| Average | 217 | 20 | 197 |