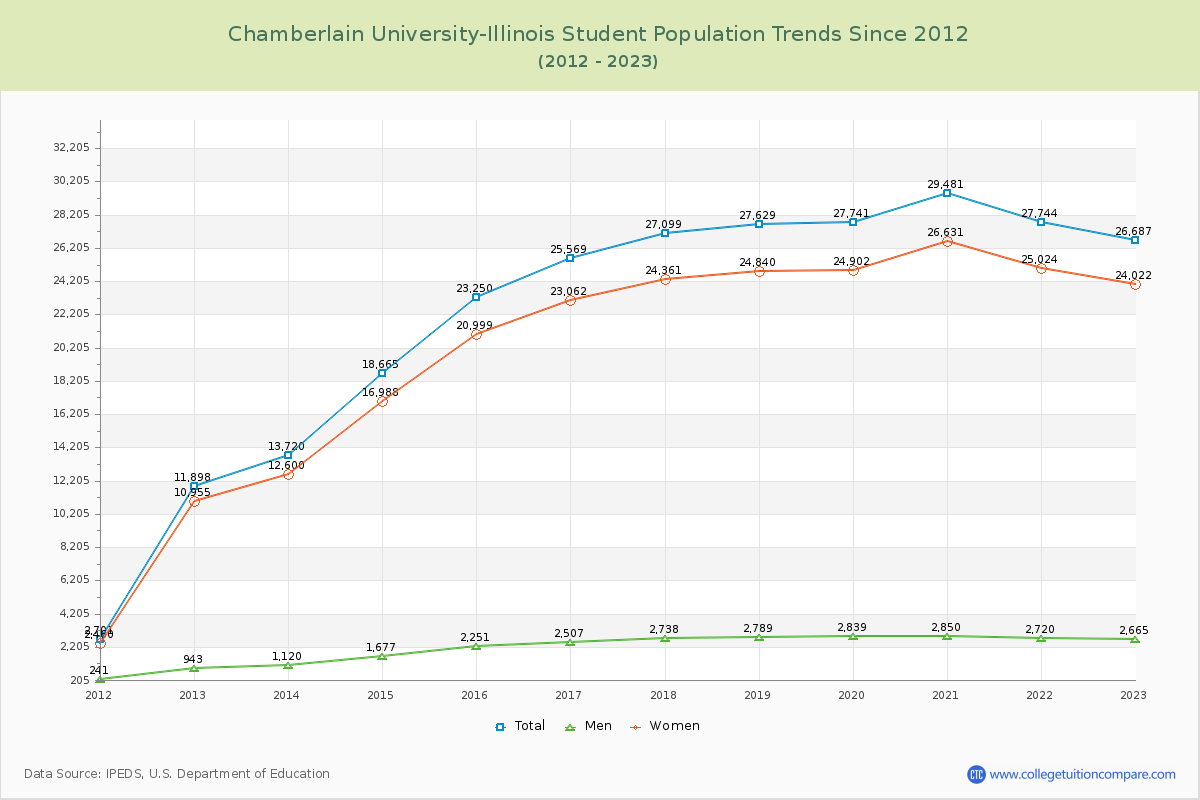
Student Population Changes
The average student population over the last 12 years is 23,589 where 26,687 students are attending the school for the academic year 2022-2023.
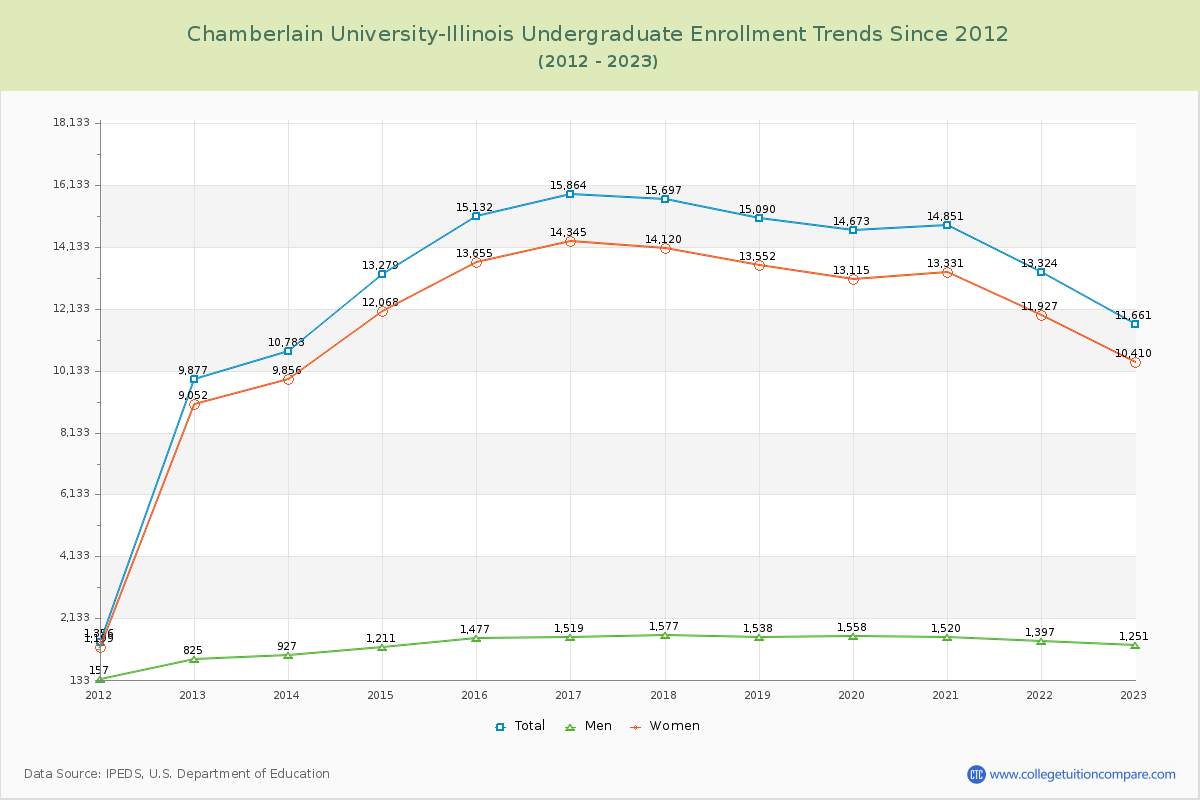
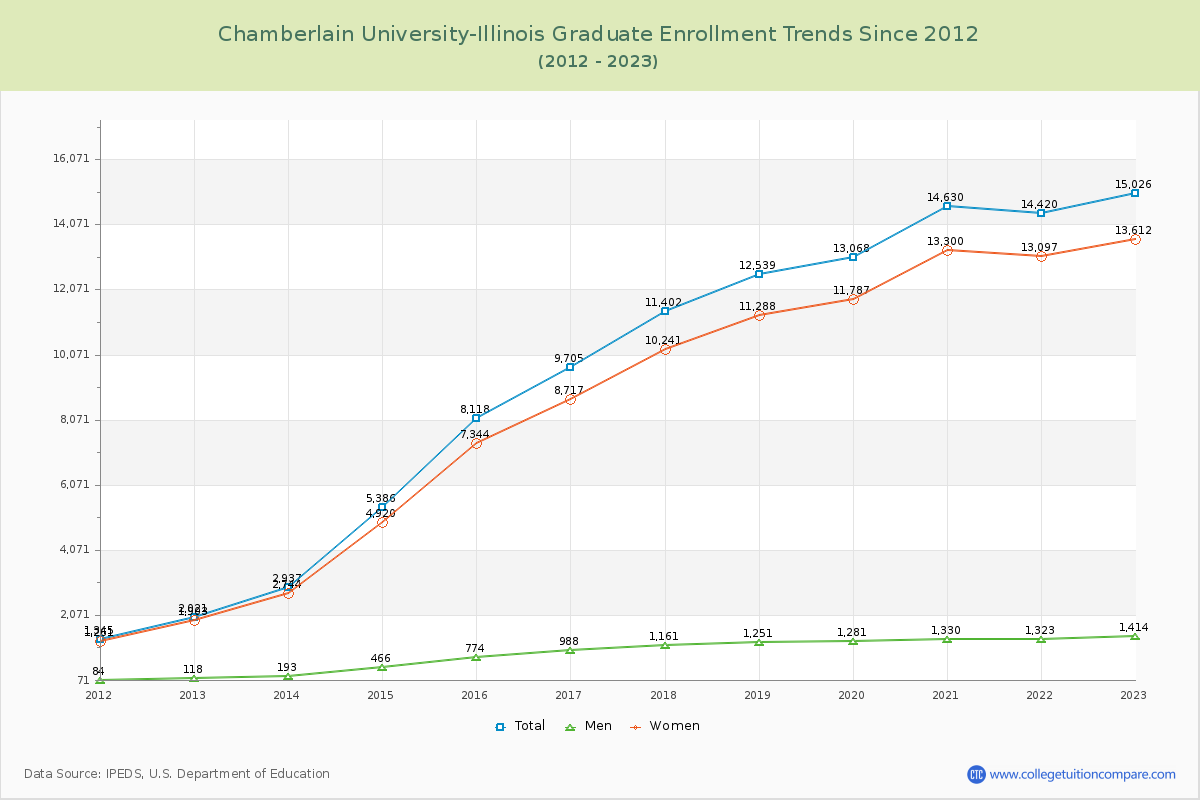
43.70% of total students is undergraduate students and 56.30% students is graduate students. The number of undergraduate students has increased by 1,784 and the graduate enrollment has increased by 13,005 over past 10 years.
The female to male ratio is 9.01 to 1 and it means that there are far more female students enrolled in Chamberlain University-Illinois than male students.
The following table and chart illustrate the changes in student population by gender at Chamberlain University-Illinois since 2012.
| Year | Total | Undergraduate | Graduate | ||||
|---|---|---|---|---|---|---|---|
| Total | Men | Women | Total | Men | Women | ||
| 2012-13 | 11,898 | 9,877 | 825 | 9,052 | 2,021 | 118 | 1,903 |
| 2013-14 | 13,720 1,822 | 10,783 906 | 927 102 | 9,856 804 | 2,937 916 | 193 75 | 2,744 841 |
| 2014-15 | 18,665 4,945 | 13,279 2,496 | 1,211 284 | 12,068 2,212 | 5,386 2,449 | 466 273 | 4,920 2,176 |
| 2015-16 | 23,250 4,585 | 15,132 1,853 | 1,477 266 | 13,655 1,587 | 8,118 2,732 | 774 308 | 7,344 2,424 |
| 2016-17 | 25,569 2,319 | 15,864 732 | 1,519 42 | 14,345 690 | 9,705 1,587 | 988 214 | 8,717 1,373 |
| 2017-18 | 27,099 1,530 | 15,697 -167 | 1,577 58 | 14,120 -225 | 11,402 1,697 | 1,161 173 | 10,241 1,524 |
| 2018-19 | 27,629 530 | 15,090 -607 | 1,538 -39 | 13,552 -568 | 12,539 1,137 | 1,251 90 | 11,288 1,047 |
| 2019-20 | 27,741 112 | 14,673 -417 | 1,558 20 | 13,115 -437 | 13,068 529 | 1,281 30 | 11,787 499 |
| 2020-21 | 29,481 1,740 | 14,851 178 | 1,520 -38 | 13,331 216 | 14,630 1,562 | 1,330 49 | 13,300 1,513 |
| 2021-22 | 27,744 -1,737 | 13,324 -1,527 | 1,397 -123 | 11,927 -1,404 | 14,420 -210 | 1,323 -7 | 13,097 -203 |
| 2022-23 | 26,687 -1,057 | 11,661 -1,663 | 1,251 -146 | 10,410 -1,517 | 15,026 606 | 1,414 91 | 13,612 515 |
| Average | 23,589 | 13,657 | 1,345 | 12,312 | 9,932 | 936 | 8,996 |