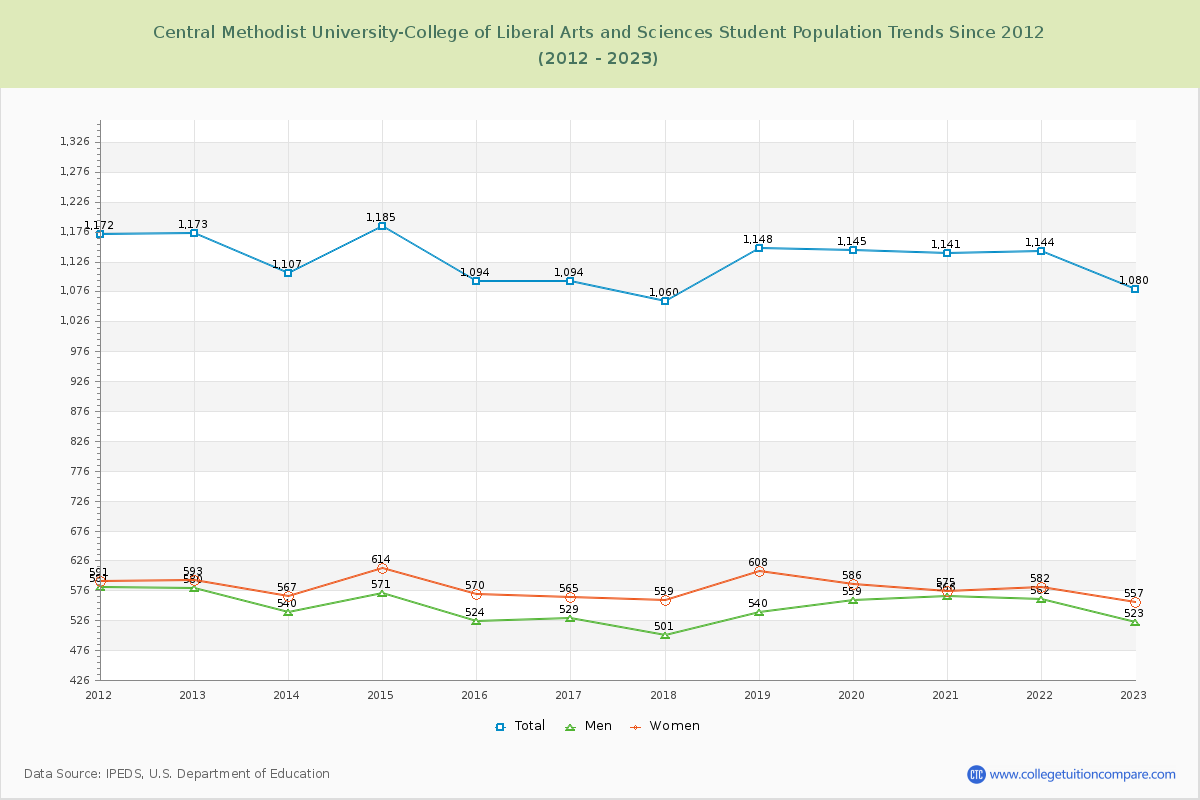
Student Population Changes
The average student population over the last 12 years is 1,125 where 1,080 students are attending the school for the academic year 2022-2023.
The female to male ratio is 1.07 to 1 and it means that there are similar numbers of female and male students enrolled in CMU CLAS.
The following table and chart illustrate the changes in student population by gender at Central Methodist University-College of Liberal Arts and Sciences since 2012.
| Year | Total | Men | Women |
|---|---|---|---|
| 2012-13 | 1,173 | 580 | 593 |
| 2013-14 | 1,107 -66 | 540 -40 | 567 -26 |
| 2014-15 | 1,185 78 | 571 31 | 614 47 |
| 2015-16 | 1,094 -91 | 524 -47 | 570 -44 |
| 2016-17 | 1,094 0 | 529 5 | 565 -5 |
| 2017-18 | 1,060 -34 | 501 -28 | 559 -6 |
| 2018-19 | 1,148 88 | 540 39 | 608 49 |
| 2019-20 | 1,145 -3 | 559 19 | 586 -22 |
| 2020-21 | 1,141 -4 | 566 7 | 575 -11 |
| 2021-22 | 1,144 3 | 562 -4 | 582 7 |
| 2022-23 | 1,080 -64 | 523 -39 | 557 -25 |
| Average | 1,125 | 545 | 580 |