Student Population Changes
The average student population over the last 12 years is 3,994 where 3,145 students are attending the school for the academic year 2022-2023.
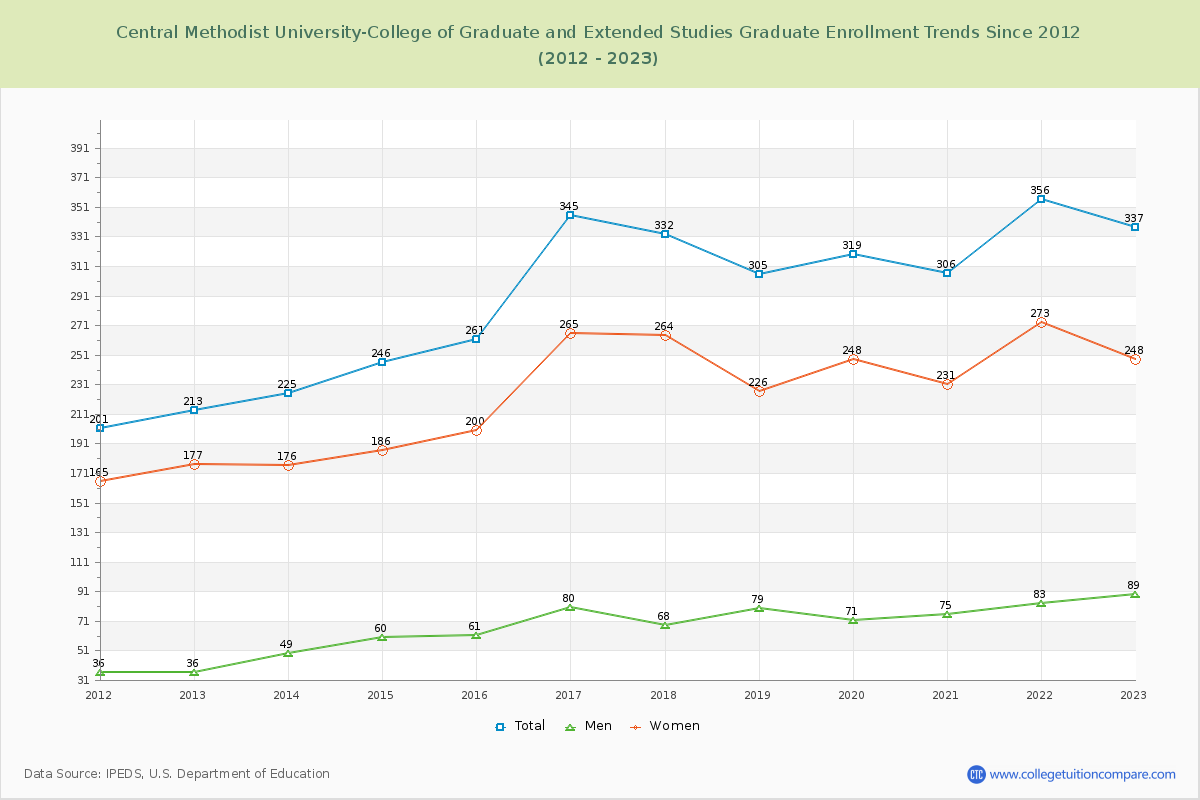
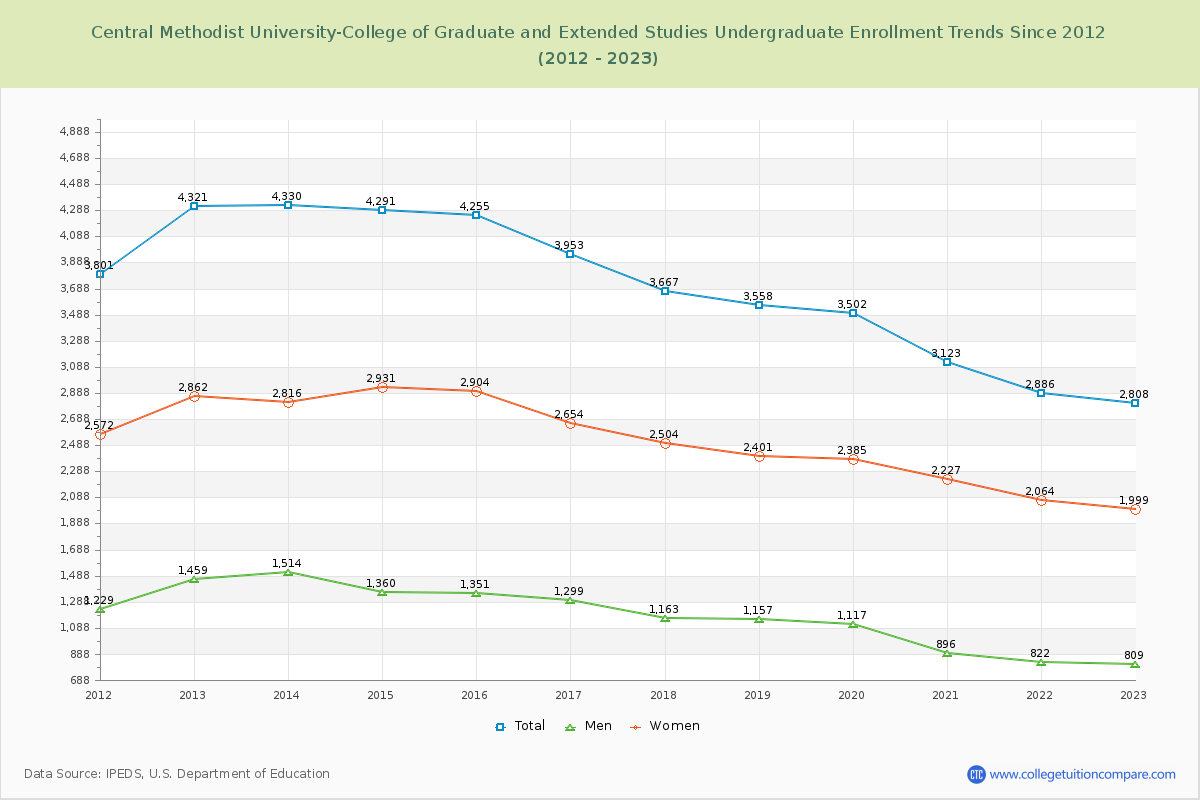
89.28% of total students is undergraduate students and 10.72% students is graduate students. The number of undergraduate students has decreased by 1,513 and the graduate enrollment has increased by 124 over past 10 years.
The female to male ratio is 2.50 to 1 and it means that there are far more female students enrolled in CMU CGES than male students.
The following table and chart illustrate the changes in student population by gender at Central Methodist University-College of Graduate and Extended Studies since 2012.
| Year | Total | Undergraduate | Graduate | ||||
|---|---|---|---|---|---|---|---|
| Total | Men | Women | Total | Men | Women | ||
| 2012-13 | 4,534 | 4,321 | 1,459 | 2,862 | 213 | 36 | 177 |
| 2013-14 | 4,555 21 | 4,330 9 | 1,514 55 | 2,816 -46 | 225 12 | 49 13 | 176 -1 |
| 2014-15 | 4,537 -18 | 4,291 -39 | 1,360 -154 | 2,931 115 | 246 21 | 60 11 | 186 10 |
| 2015-16 | 4,516 -21 | 4,255 -36 | 1,351 -9 | 2,904 -27 | 261 15 | 61 1 | 200 14 |
| 2016-17 | 4,298 -218 | 3,953 -302 | 1,299 -52 | 2,654 -250 | 345 84 | 80 19 | 265 65 |
| 2017-18 | 3,999 -299 | 3,667 -286 | 1,163 -136 | 2,504 -150 | 332 -13 | 68 -12 | 264 -1 |
| 2018-19 | 3,863 -136 | 3,558 -109 | 1,157 -6 | 2,401 -103 | 305 -27 | 79 11 | 226 -38 |
| 2019-20 | 3,821 -42 | 3,502 -56 | 1,117 -40 | 2,385 -16 | 319 14 | 71 -8 | 248 22 |
| 2020-21 | 3,429 -392 | 3,123 -379 | 896 -221 | 2,227 -158 | 306 -13 | 75 4 | 231 -17 |
| 2021-22 | 3,242 -187 | 2,886 -237 | 822 -74 | 2,064 -163 | 356 50 | 83 8 | 273 42 |
| 2022-23 | 3,145 -97 | 2,808 -78 | 809 -13 | 1,999 -65 | 337 -19 | 89 6 | 248 -25 |
| Average | 3,994 | 3,699 | 1,177 | 2,522 | 295 | 68 | 227 |