Enrollment Trends at Central Christian College of the Bible

-82

Total Enrollment

-9

Men

-73

Women

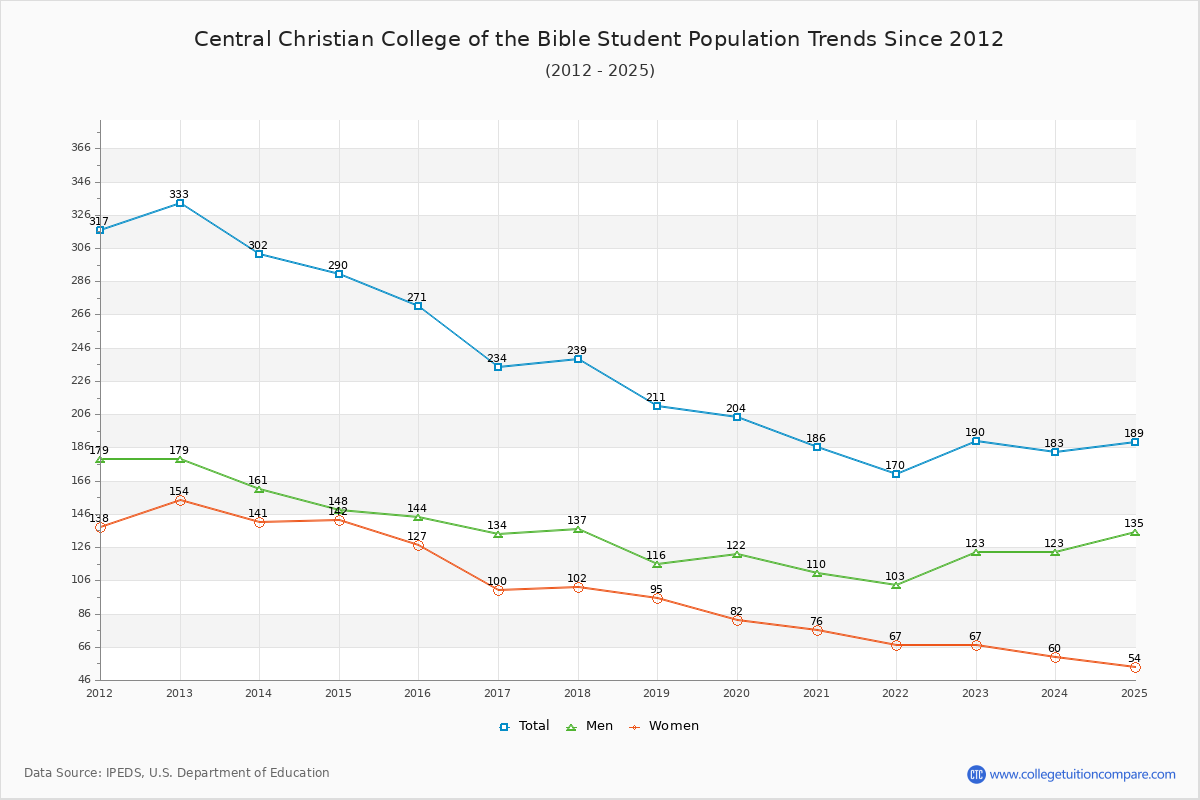
The student population at Central Christian College of the Bible is 189 (165 undergraduate and 24 graduate students) . The number of students has decreased by 82 over the past decade.

The percentage of undergraduate students at Central Christian College of the Bible is 87.30% which is decreased by 106 over last 10 years. The graduate student population increased by 24 and it has been increasing.

The female to male ratio is 0.40 to 1 which means that majority of population is on male students.

79 students enrolled in online degree program exclusively and the number of online students has increased by 125.71% since 2015.

Student Population Changes

The average student population over the last 11 years is 208 where 189 students are attending the school for the academic year 2024-2025.

87.30% of total students is undergraduate students and 12.70% students is graduate students. The number of undergraduate students has decreased by 106 and the graduate enrollment has increased by 24 over past 10 years.

The female to male ratio is 0.40 to 1 and it means that there are far more male students enrolled in Central Christian College of the Bible than female students.

The following table and chart illustrate the changes in student population by gender at Central Christian College of the Bible since 2015.

YearTotalUndergraduateGraduate
TotalMenWomenTotalMenWomen
2015-16271271144127000
2016-17234
-37
234
-37
134
-10
100
-27
000
2017-18239
5
239
5
137
3
102
2
000
2018-19211
-28
211
-28
116
-21
95
-7
000
2019-20204
-7
204
-7
122
6
82
-13
000
2020-21186
-18
173
-31
97
-25
76
-6
13
13
13
13
0
2021-22170
-16
141
-32
79
-18
62
-14
29
16
24
11
5
5
2022-23190
20
157
16
94
15
63
1
33
4
29
5
4
-1
2023-24183
-7
155
-2
96
2
59
-4
28
-5
27
-2
1
-3
2024-25189
6
165
10
113
17
52
-7
24
-4
22
-5
2
1
Average2081951138213121
Central Christian College of the Bible Enrollment Trends Chart

Undergraduate Enrollment Changes

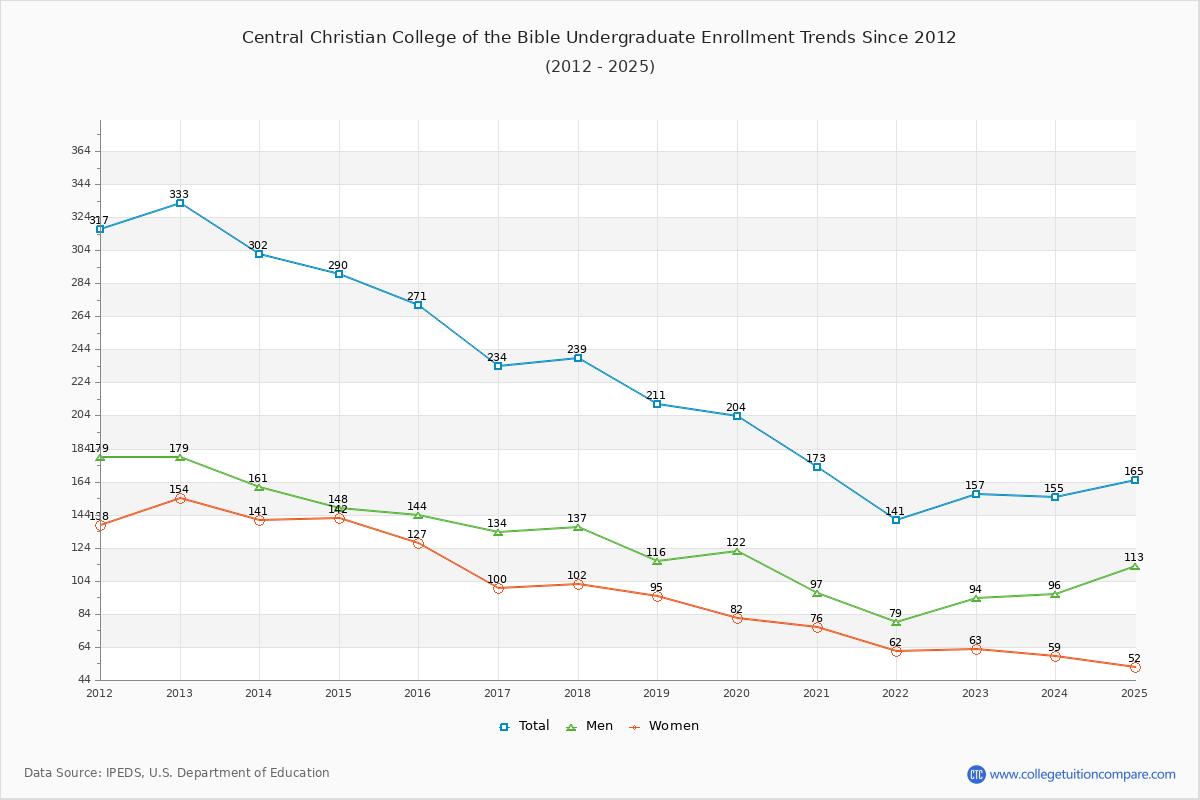
The average number of Undergraduate students over the last 11 years is 195 where 165 students are attending the Undergraduate school for the academic year 2024-2025. The following table and chart illustrate the changes in Undergraduate enrollment by attending status and gender at Central Christian College of the Bible since 2015.

YearTotalFull-timePart-time
TotalMenWomenTotalMenWomen
2015-16271228119109432518
2016-172342011109133249
2017-1823918510085543717
2018-192111628775492920
2019-202041559164493118
2020-211731347757392019
2021-22141824735593227
2022-23157945440634023
2023-241551066442493217
2024-251651167541493811
Average19519582641953118
Central Christian College of the Bible Undergraduate Enrollment Trends Chart

Graduate Enrollment Changes

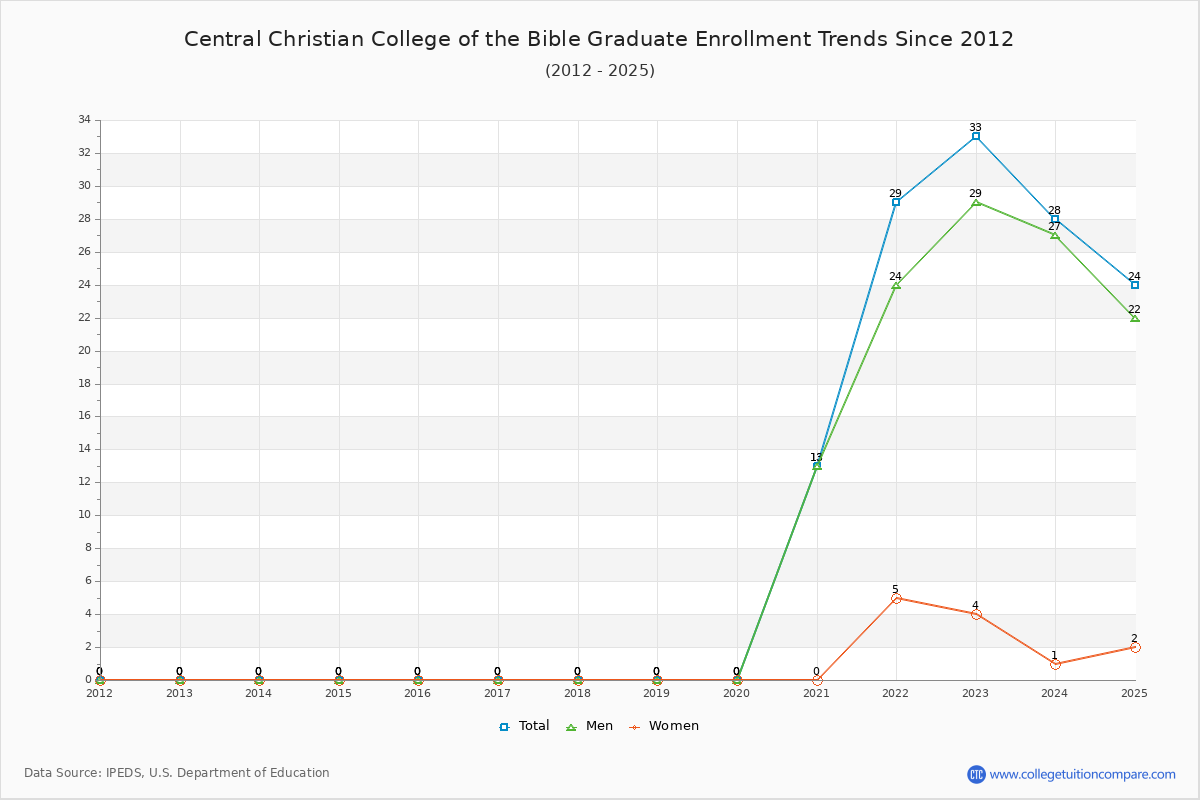
The average number of Graduate students over the last 11 years is 13 where 24 students are attending the Graduate school for the academic year 2024-2025. The following table and chart illustrate the changes in Graduate enrollment by attending status and gender at Central Christian College of the Bible since 2015.

YearTotalFull-timePart-time
TotalMenWomenTotalMenWomen
2015-160000000
2016-170000000
2017-180000000
2018-190000000
2019-200000000
2020-211310100330
2021-222923185660
2022-233324204990
2023-242824231440
2024-252419181541
Average1313911330
Central Christian College of the Bible Graduate Enrollment Trends Chart

Enrollment by Race/Ethnicity Changes

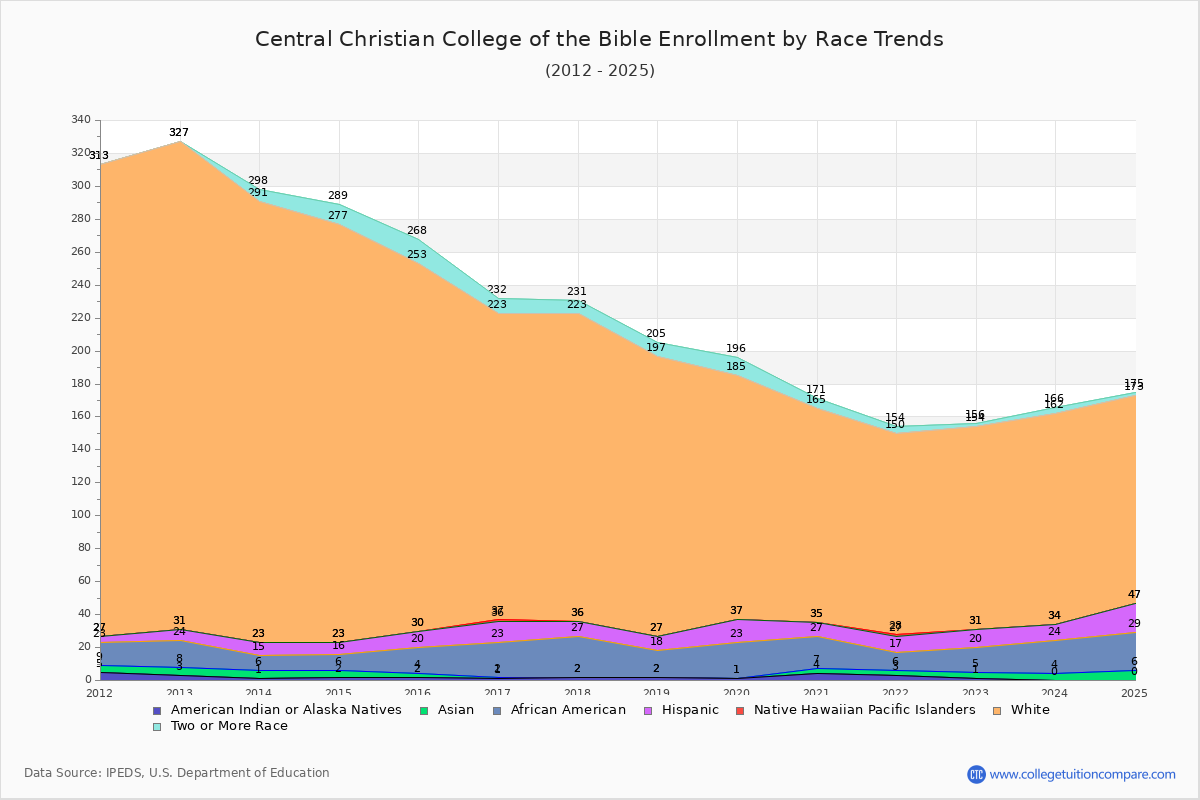
The percentage of white students is 66.67%. The percentage was 82.29% 10 years ago and Central Christian College of the Bible still has a high percentage of white students. 3.17% of enrolled students is Asian and 12.17% is black students. Hispanic students comprise 9.52% of the student body.

Over the past 10 years, the racial composition has shifted. The percentage of white students decreased from 82.29% to 66.67%. Asian enrollment grew from 0.74% to 3.17%. Black student enrollment increased from 5.90% to 12.17%. Hispanic student representation expanded from 3.69% to 9.52%.

The overall racial diversity, measured by the Census Bureau Diversity Index, is 0.5306 which indicates that somewhat diverse. This increased from 0.3149 a decade ago, suggesting that racial diversity has improved.

The following table and chart illustrate the student population trends by race/ethnicity at Central Christian College of the Bible over the past 11 years (2015-2025).

YearAmerican Indian or Native AmericanAsianBlackHispanicNative Hawaiian or Other Pacific IslanderWhiteTwo or More Races
2015-16221610022315
2016-1711211311869
2017-182025901878
2018-192016901708
2019-20102214014811
2020-214320801306
2021-2233111011224
2022-2314151101232
2023-2404201001284
2024-2506231801262
Average22191101547
Central Christian College of the Bible Enrollment by Race Trends Chart

Distance Learning (Online Courses) Enrollment Changes

79 students are enrolled in online degree programs exclusively for the academic year 2024-2025, which is 42% of total students. The number of online students has increased 125.71% since 2015. The following table and chart illustrate the changes in the online student population by enrolled type at Central Christian College of the Bible from 2015 to 2025.

YearTotal EnrollmentOnline CompletelyEnrolled in Some Online CoursesNot Enrolled in Online Courses
2015-162713563173
2016-172343762135
2017-182394560134
2018-192114517149
2019-202043826140
2020-21186553893
2021-22170257768
2022-23190207892
2023-24183586164
2024-25189793575
Average2084452112

Ratings & Review

Share your experiences and thoughts about Central Christian College of the Bible. It will be a great help to applicants and prospective students!