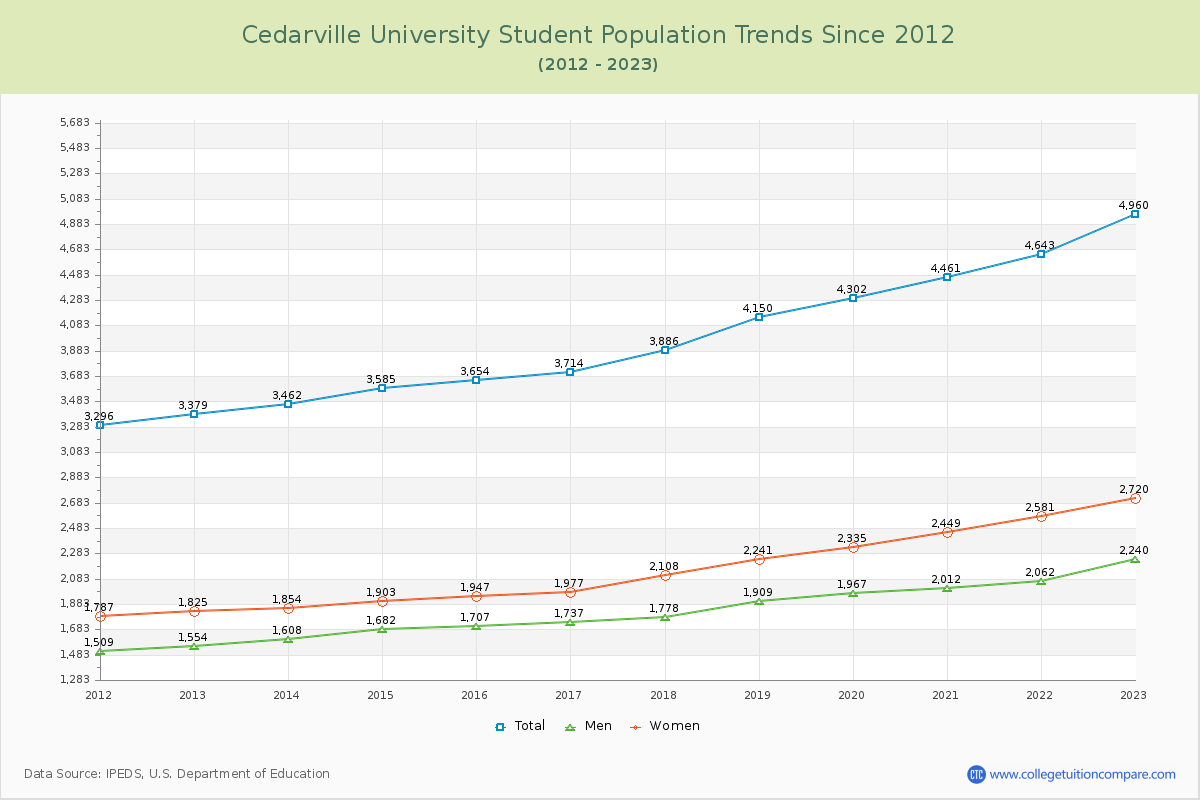
Student Population Changes
The average student population over the last 12 years is 4,018 where 4,960 students are attending the school for the academic year 2022-2023.
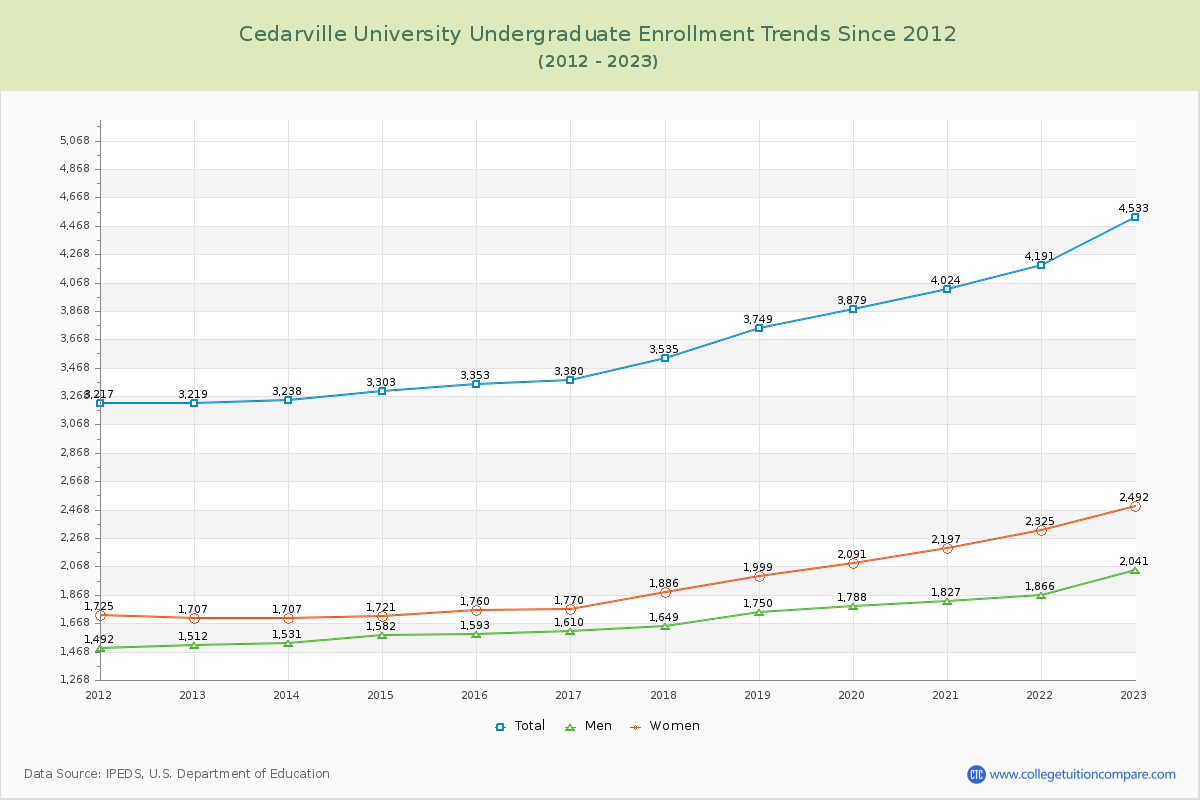
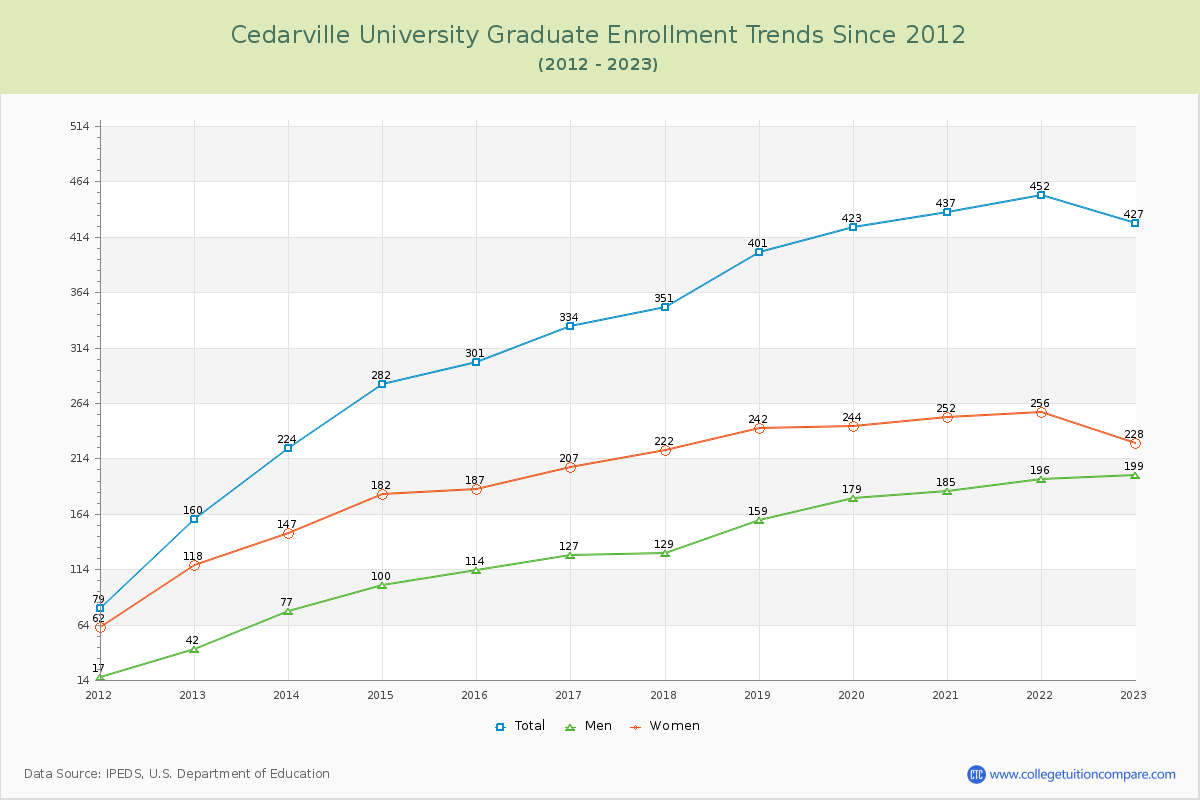
91.39% of total students is undergraduate students and 8.61% students is graduate students. The number of undergraduate students has increased by 1,314 and the graduate enrollment has increased by 267 over past 10 years.
The female to male ratio is 1.21 to 1 and it means that there are slightly more female students enrolled in Cedarville than male students.
The following table and chart illustrate the changes in student population by gender at Cedarville University since 2012.
| Year | Total | Undergraduate | Graduate | ||||
|---|---|---|---|---|---|---|---|
| Total | Men | Women | Total | Men | Women | ||
| 2012-13 | 3,379 | 3,219 | 1,512 | 1,707 | 160 | 42 | 118 |
| 2013-14 | 3,462 83 | 3,238 19 | 1,531 19 | 1,707 0 | 224 64 | 77 35 | 147 29 |
| 2014-15 | 3,585 123 | 3,303 65 | 1,582 51 | 1,721 14 | 282 58 | 100 23 | 182 35 |
| 2015-16 | 3,654 69 | 3,353 50 | 1,593 11 | 1,760 39 | 301 19 | 114 14 | 187 5 |
| 2016-17 | 3,714 60 | 3,380 27 | 1,610 17 | 1,770 10 | 334 33 | 127 13 | 207 20 |
| 2017-18 | 3,886 172 | 3,535 155 | 1,649 39 | 1,886 116 | 351 17 | 129 2 | 222 15 |
| 2018-19 | 4,150 264 | 3,749 214 | 1,750 101 | 1,999 113 | 401 50 | 159 30 | 242 20 |
| 2019-20 | 4,302 152 | 3,879 130 | 1,788 38 | 2,091 92 | 423 22 | 179 20 | 244 2 |
| 2020-21 | 4,461 159 | 4,024 145 | 1,827 39 | 2,197 106 | 437 14 | 185 6 | 252 8 |
| 2021-22 | 4,643 182 | 4,191 167 | 1,866 39 | 2,325 128 | 452 15 | 196 11 | 256 4 |
| 2022-23 | 4,960 317 | 4,533 342 | 2,041 175 | 2,492 167 | 427 -25 | 199 3 | 228 -28 |
| Average | 4,018 | 3,673 | 1,704 | 1,969 | 345 | 137 | 208 |