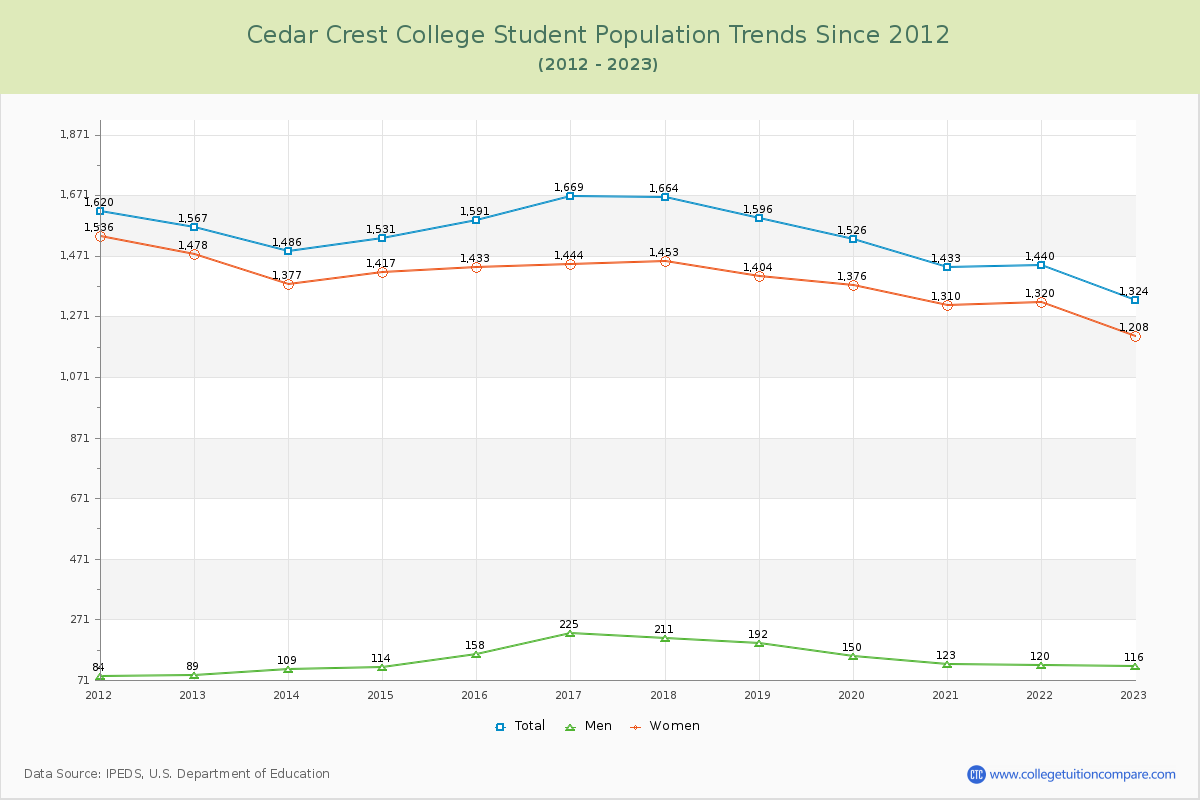
Student Population Changes
The average student population over the last 12 years is 1,530 where 1,324 students are attending the school for the academic year 2022-2023.
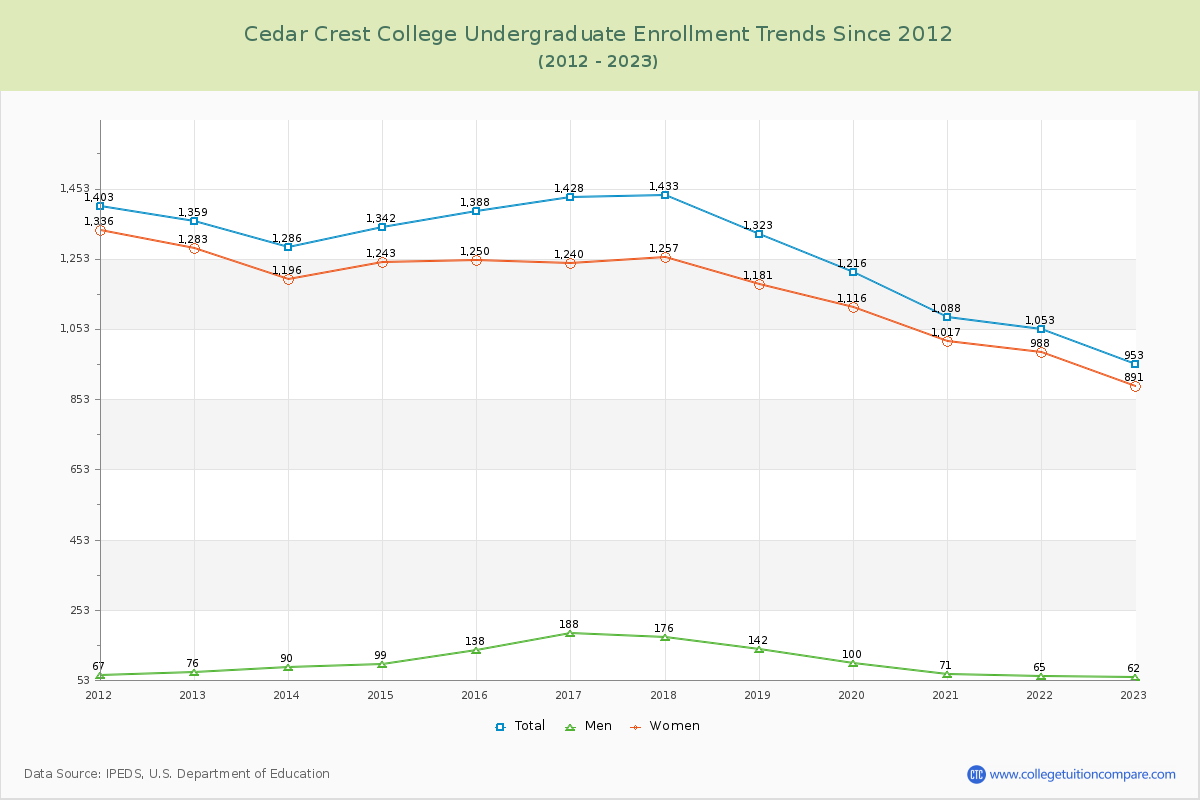
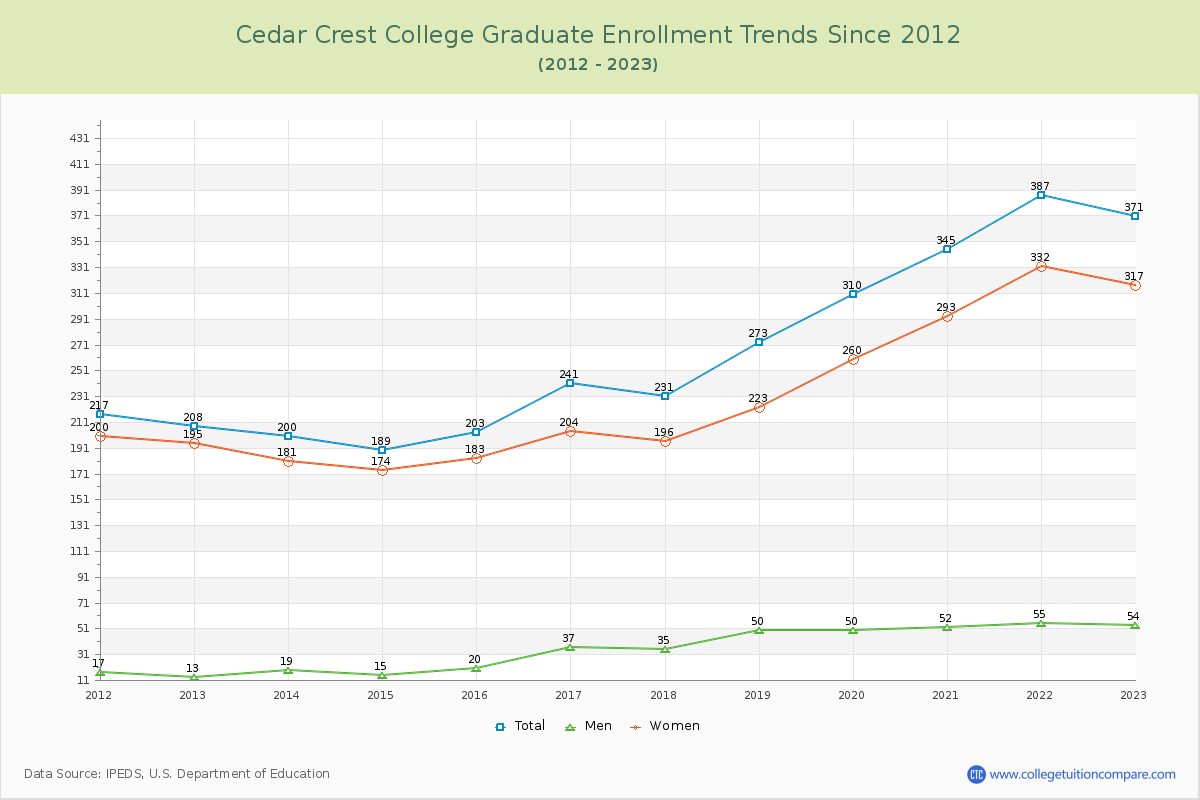
71.98% of total students is undergraduate students and 28.02% students is graduate students. The number of undergraduate students has decreased by 406 and the graduate enrollment has increased by 163 over past 10 years.
The following table and chart illustrate the changes in student population by gender at Cedar Crest College since 2012.
| Year | Total | Undergraduate | Graduate | ||||
|---|---|---|---|---|---|---|---|
| Total | Men | Women | Total | Men | Women | ||
| 2012-13 | 1,567 | 1,359 | 76 | 1,283 | 208 | 13 | 195 |
| 2013-14 | 1,486 -81 | 1,286 -73 | 90 14 | 1,196 -87 | 200 -8 | 19 6 | 181 -14 |
| 2014-15 | 1,531 45 | 1,342 56 | 99 9 | 1,243 47 | 189 -11 | 15 -4 | 174 -7 |
| 2015-16 | 1,591 60 | 1,388 46 | 138 39 | 1,250 7 | 203 14 | 20 5 | 183 9 |
| 2016-17 | 1,669 78 | 1,428 40 | 188 50 | 1,240 -10 | 241 38 | 37 17 | 204 21 |
| 2017-18 | 1,664 -5 | 1,433 5 | 176 -12 | 1,257 17 | 231 -10 | 35 -2 | 196 -8 |
| 2018-19 | 1,596 -68 | 1,323 -110 | 142 -34 | 1,181 -76 | 273 42 | 50 15 | 223 27 |
| 2019-20 | 1,526 -70 | 1,216 -107 | 100 -42 | 1,116 -65 | 310 37 | 50 0 | 260 37 |
| 2020-21 | 1,433 -93 | 1,088 -128 | 71 -29 | 1,017 -99 | 345 35 | 52 2 | 293 33 |
| 2021-22 | 1,440 7 | 1,053 -35 | 65 -6 | 988 -29 | 387 42 | 55 3 | 332 39 |
| 2022-23 | 1,324 -116 | 953 -100 | 62 -3 | 891 -97 | 371 -16 | 54 -1 | 317 -15 |
| Average | 1,530 | 1,261 | 110 | 1,151 | 269 | 36 | 233 |