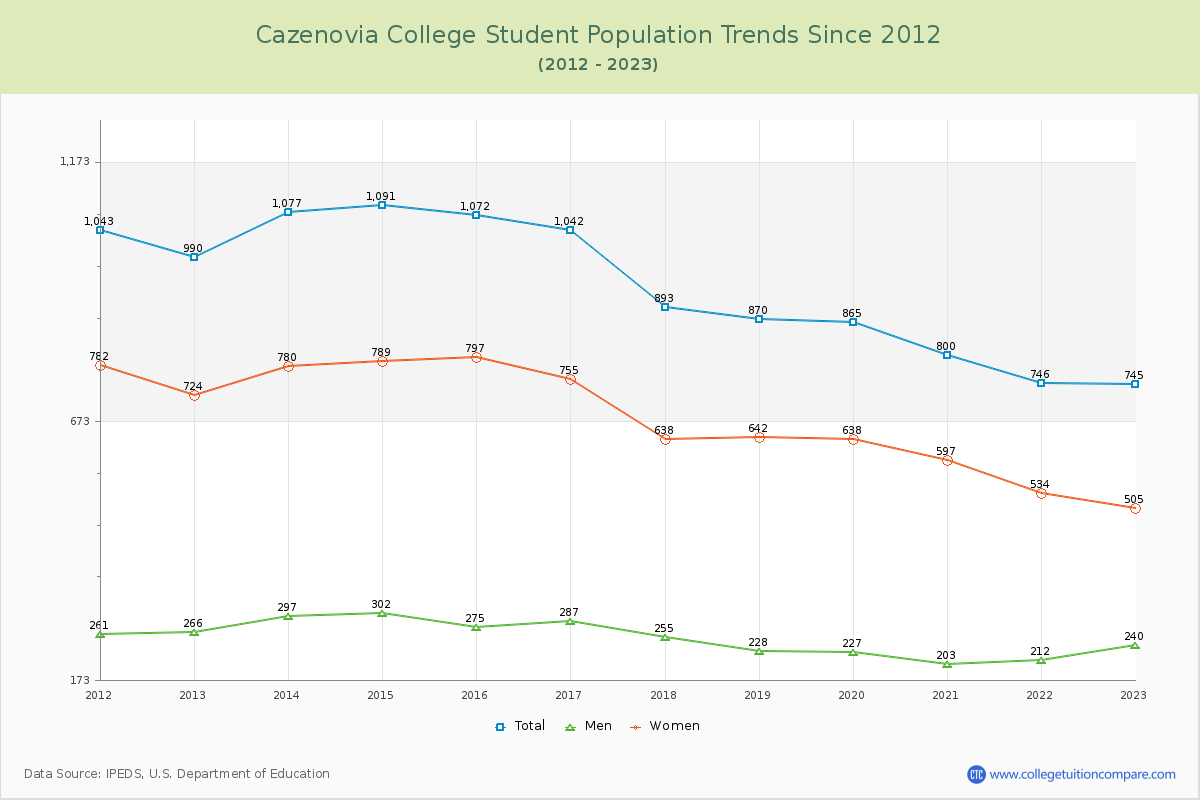
Student Population Changes
The average student population over the last 12 years is 926 where 745 students are attending the school for the academic year 2022-2023.
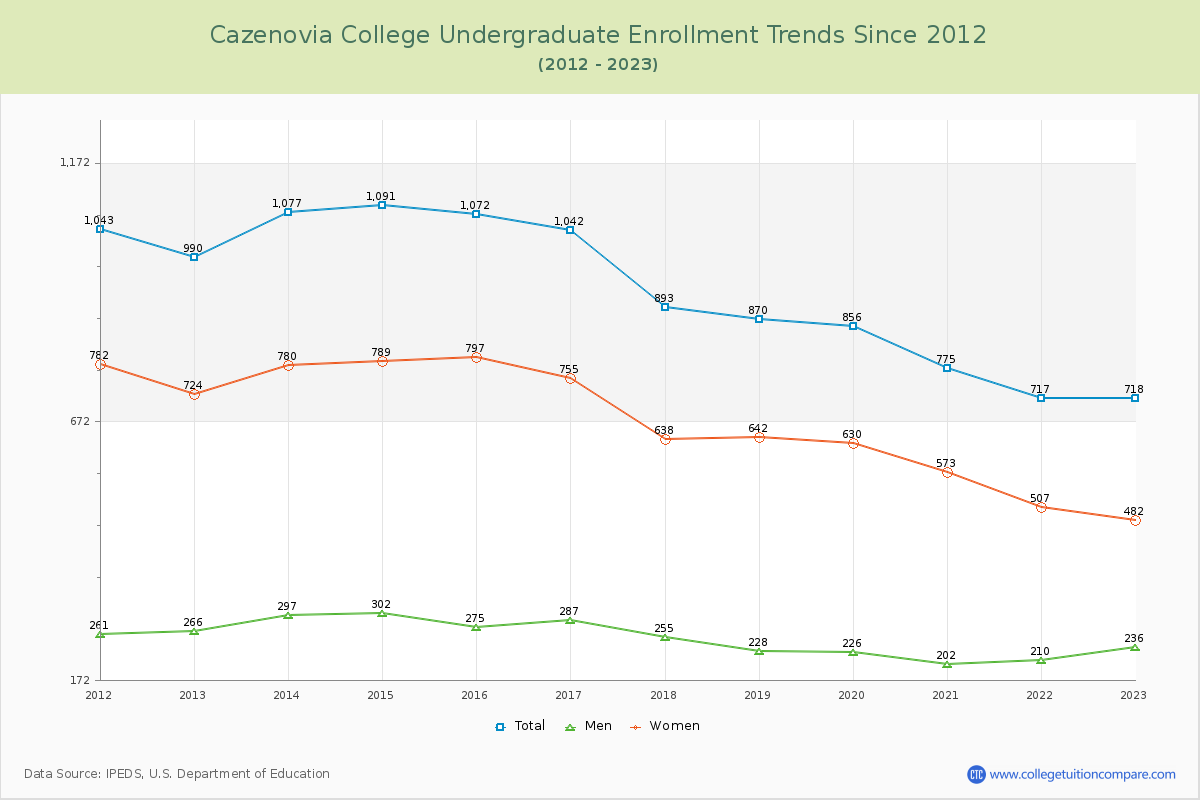
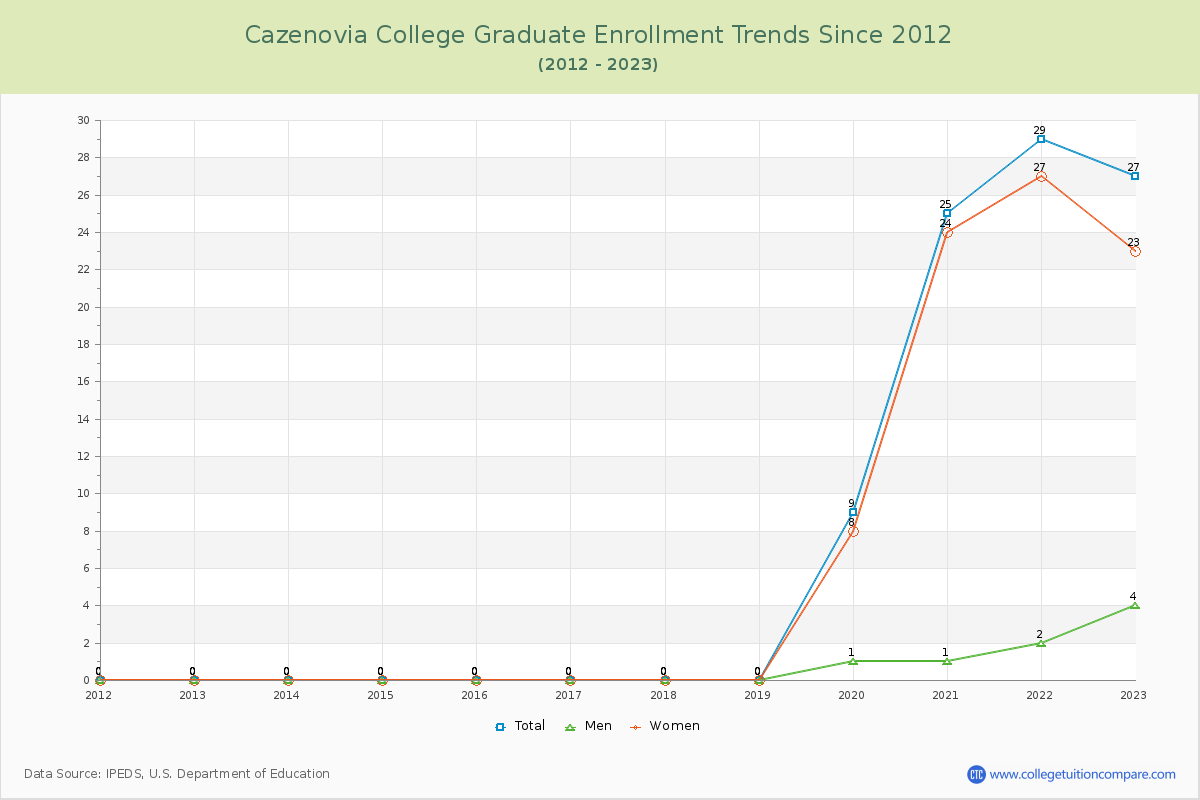
96.38% of total students is undergraduate students and 3.62% students is graduate students. The number of undergraduate students has decreased by 272 and the graduate enrollment has increased by 27 over past 10 years.
The female to male ratio is 2.10 to 1 and it means that there are far more female students enrolled in Cazenovia than male students.
The following table and chart illustrate the changes in student population by gender at Cazenovia College since 2012.
| Year | Total | Undergraduate | Graduate | ||||
|---|---|---|---|---|---|---|---|
| Total | Men | Women | Total | Men | Women | ||
| 2012-13 | 990 | 990 | 266 | 724 | 0 | 0 | 0 |
| 2013-14 | 1,077 87 | 1,077 87 | 297 31 | 780 56 | 0 0 | 0 0 | 0 0 |
| 2014-15 | 1,091 14 | 1,091 14 | 302 5 | 789 9 | 0 0 | 0 0 | 0 0 |
| 2015-16 | 1,072 -19 | 1,072 -19 | 275 -27 | 797 8 | 0 0 | 0 0 | 0 0 |
| 2016-17 | 1,042 -30 | 1,042 -30 | 287 12 | 755 -42 | 0 0 | 0 0 | 0 0 |
| 2017-18 | 893 -149 | 893 -149 | 255 -32 | 638 -117 | 0 0 | 0 0 | 0 0 |
| 2018-19 | 870 -23 | 870 -23 | 228 -27 | 642 4 | 0 0 | 0 0 | 0 0 |
| 2019-20 | 865 -5 | 856 -14 | 226 -2 | 630 -12 | 9 9 | 1 1 | 8 8 |
| 2020-21 | 800 -65 | 775 -81 | 202 -24 | 573 -57 | 25 16 | 1 0 | 24 16 |
| 2021-22 | 746 -54 | 717 -58 | 210 8 | 507 -66 | 29 4 | 2 1 | 27 3 |
| 2022-23 | 745 -1 | 718 1 | 236 26 | 482 -25 | 27 -2 | 4 2 | 23 -4 |
| Average | 926 | 918 | 253 | 665 | 8 | 1 | 7 |