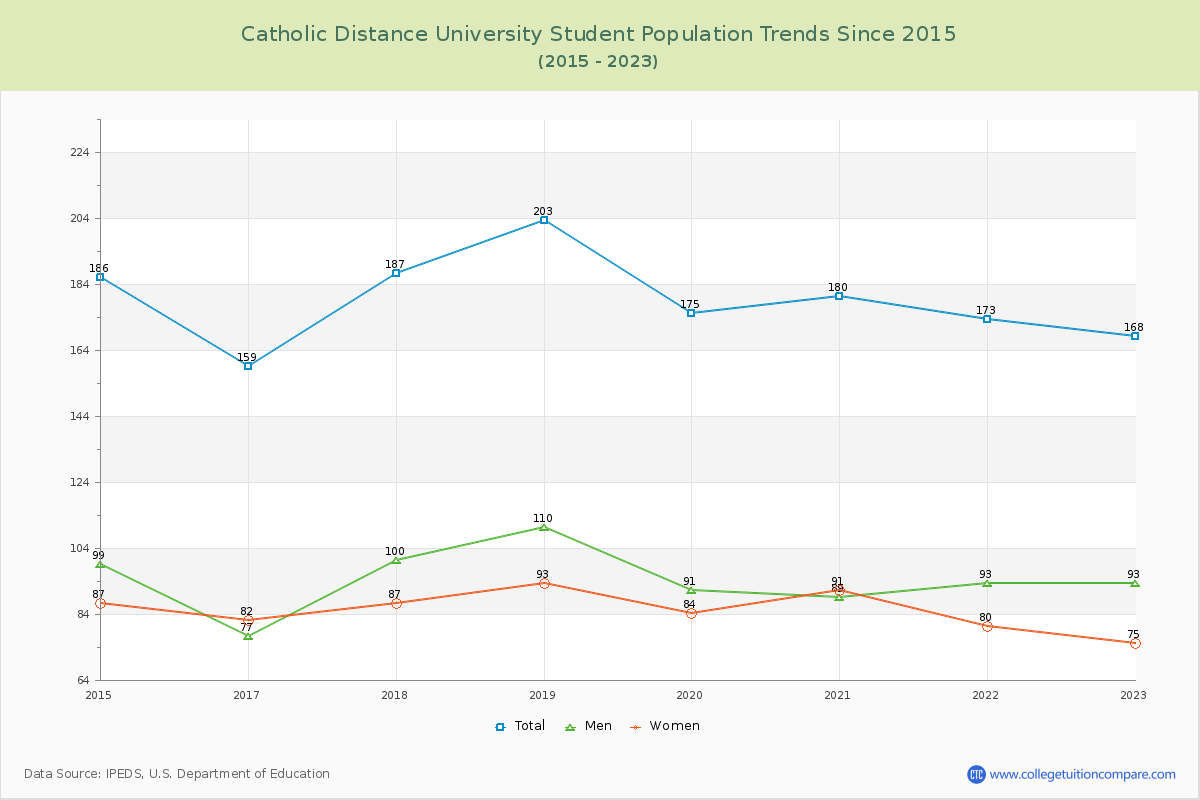
Student Population Changes
The average student population over the last 10 years is 159 where 168 students are attending the school for the academic year 2022-2023.
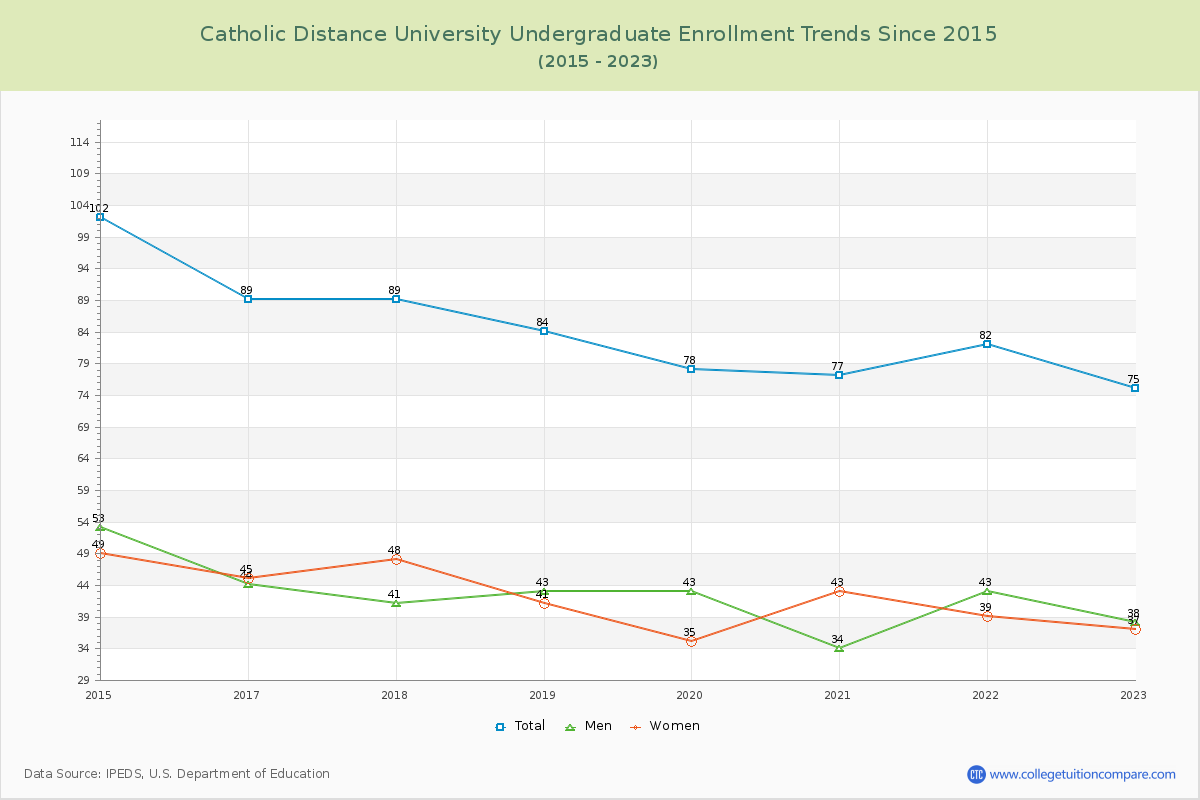
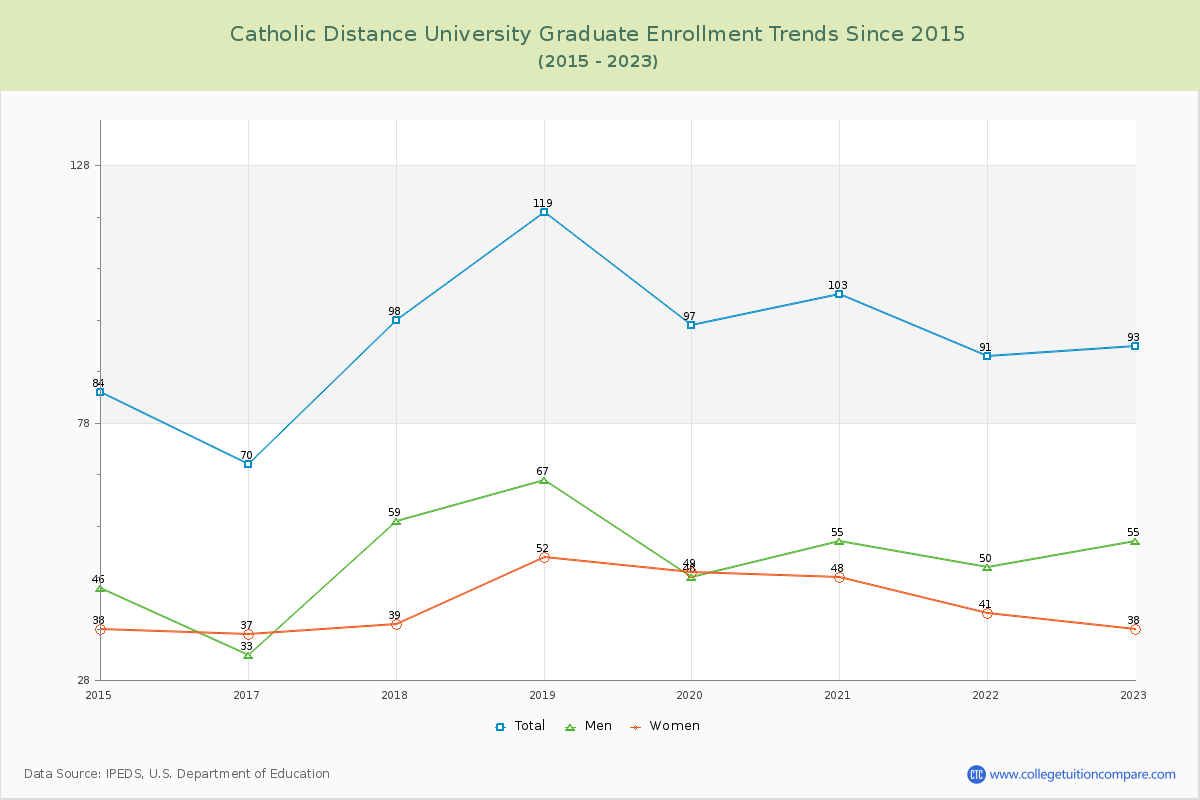
44.64% of total students is undergraduate students and 55.36% students is graduate students. The number of undergraduate students has decreased by 27 and the graduate enrollment has increased by 9 over past 10 years.
The female to male ratio is 0.81 to 1 and it means that there are slightly more male students enrolled in CDU than female students.
The following table and chart illustrate the changes in student population by gender at Catholic Distance University since 2014.
| Year | Total | Undergraduate | Graduate | ||||
|---|---|---|---|---|---|---|---|
| Total | Men | Women | Total | Men | Women | ||
| 2014-15 | 186 | 102 | 53 | 49 | 84 | 46 | 38 |
| 2015-16 | 0 -186 | 0 -102 | 0 -53 | 0 -49 | 0 -84 | 0 -46 | 0 -38 |
| 2016-17 | 159 159 | 89 89 | 44 44 | 45 45 | 70 70 | 33 33 | 37 37 |
| 2017-18 | 187 28 | 89 0 | 41 -3 | 48 3 | 98 28 | 59 26 | 39 2 |
| 2018-19 | 203 16 | 84 -5 | 43 2 | 41 -7 | 119 21 | 67 8 | 52 13 |
| 2019-20 | 175 -28 | 78 -6 | 43 0 | 35 -6 | 97 -22 | 48 -19 | 49 -3 |
| 2020-21 | 180 5 | 77 -1 | 34 -9 | 43 8 | 103 6 | 55 7 | 48 -1 |
| 2021-22 | 173 -7 | 82 5 | 43 9 | 39 -4 | 91 -12 | 50 -5 | 41 -7 |
| 2022-23 | 168 -5 | 75 -7 | 38 -5 | 37 -2 | 93 2 | 55 5 | 38 -3 |
| Average | 159 | 75 | 38 | 37 | 84 | 46 | 38 |