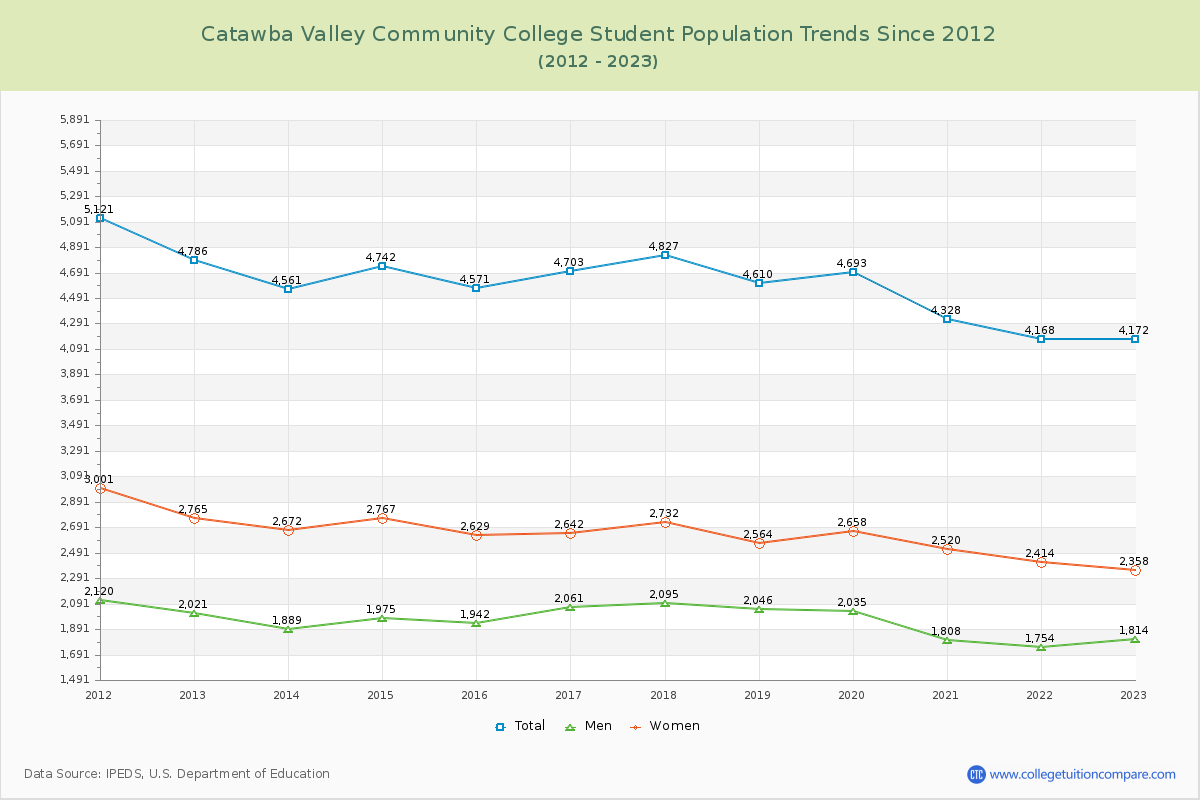
Student Population Changes
The average student population over the last 12 years is 4,560 where 4,172 students are attending the school for the academic year 2022-2023.
The female to male ratio is 1.30 to 1 and it means that there are slightly more female students enrolled in CVCC than male students.
The following table and chart illustrate the changes in student population by gender at Catawba Valley Community College since 2012.
| Year | Total | Men | Women |
|---|---|---|---|
| 2012-13 | 4,786 | 2,021 | 2,765 |
| 2013-14 | 4,561 -225 | 1,889 -132 | 2,672 -93 |
| 2014-15 | 4,742 181 | 1,975 86 | 2,767 95 |
| 2015-16 | 4,571 -171 | 1,942 -33 | 2,629 -138 |
| 2016-17 | 4,703 132 | 2,061 119 | 2,642 13 |
| 2017-18 | 4,827 124 | 2,095 34 | 2,732 90 |
| 2018-19 | 4,610 -217 | 2,046 -49 | 2,564 -168 |
| 2019-20 | 4,693 83 | 2,035 -11 | 2,658 94 |
| 2020-21 | 4,328 -365 | 1,808 -227 | 2,520 -138 |
| 2021-22 | 4,168 -160 | 1,754 -54 | 2,414 -106 |
| 2022-23 | 4,172 4 | 1,814 60 | 2,358 -56 |
| Average | 4,560 | 1,949 | 2,611 |