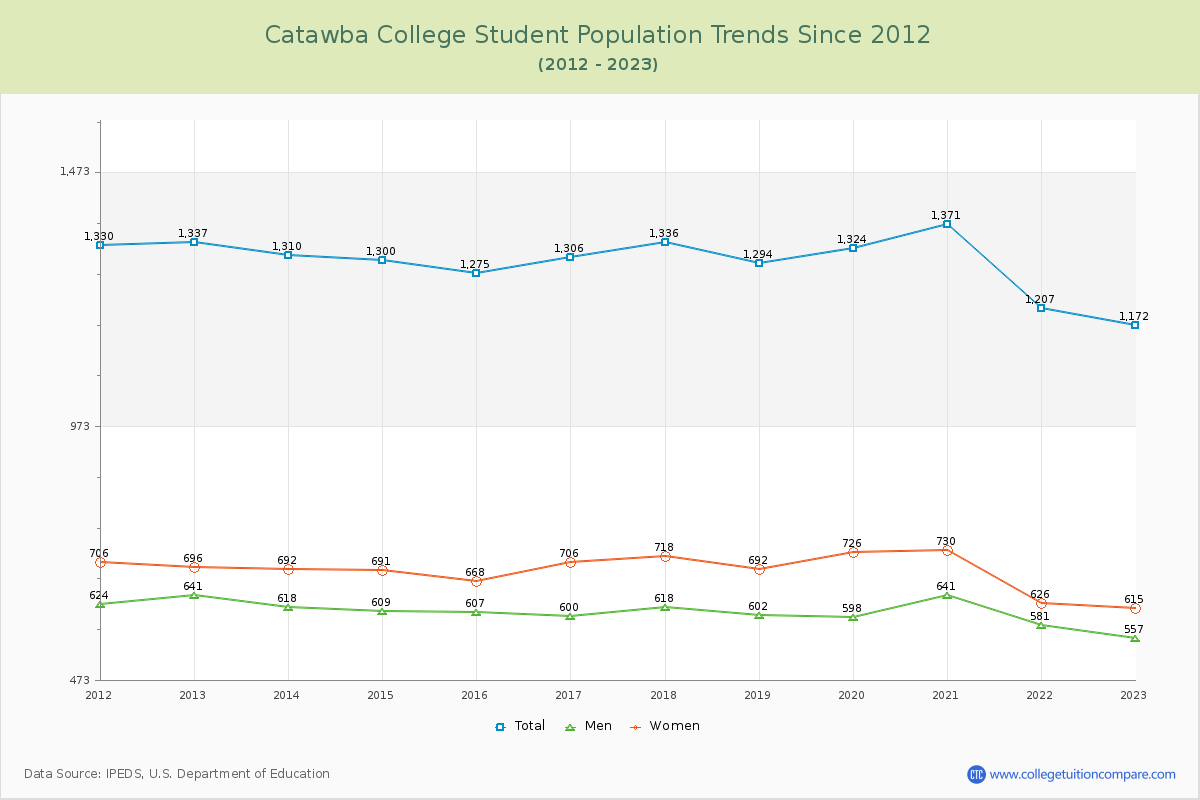
Student Population Changes
The average student population over the last 12 years is 1,294 where 1,172 students are attending the school for the academic year 2022-2023.
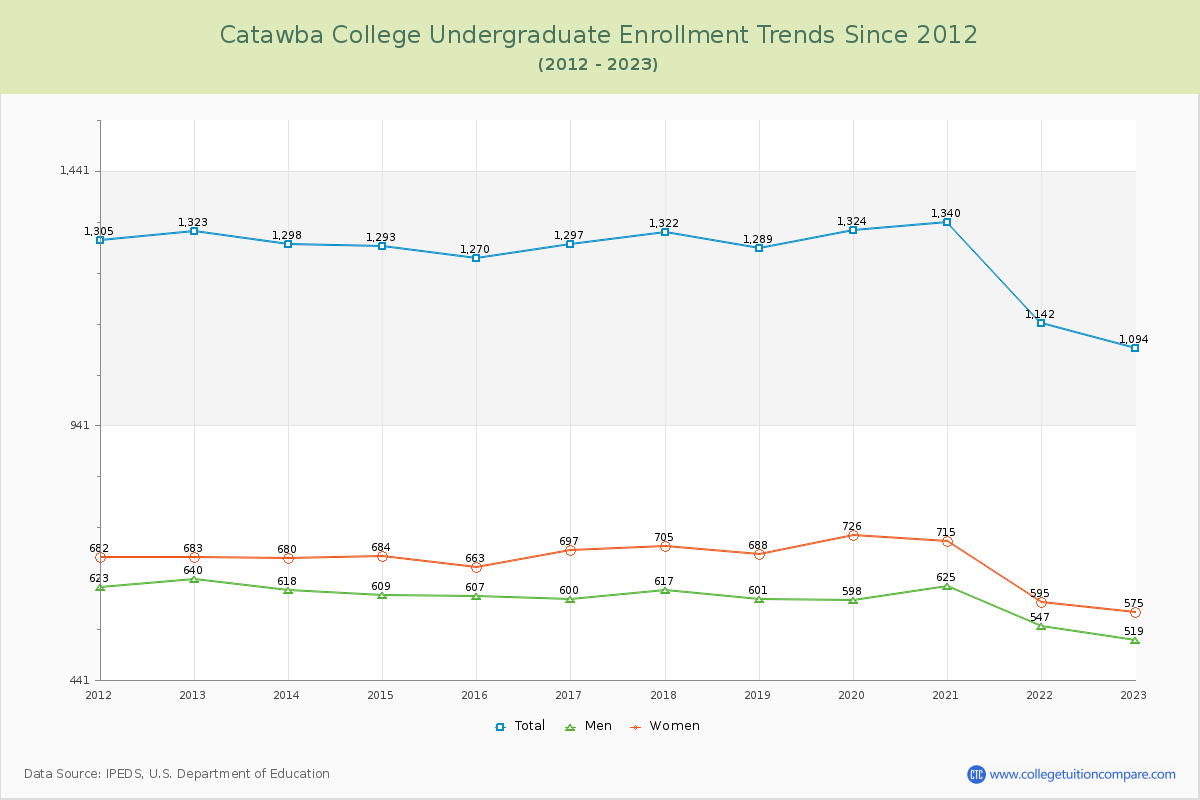
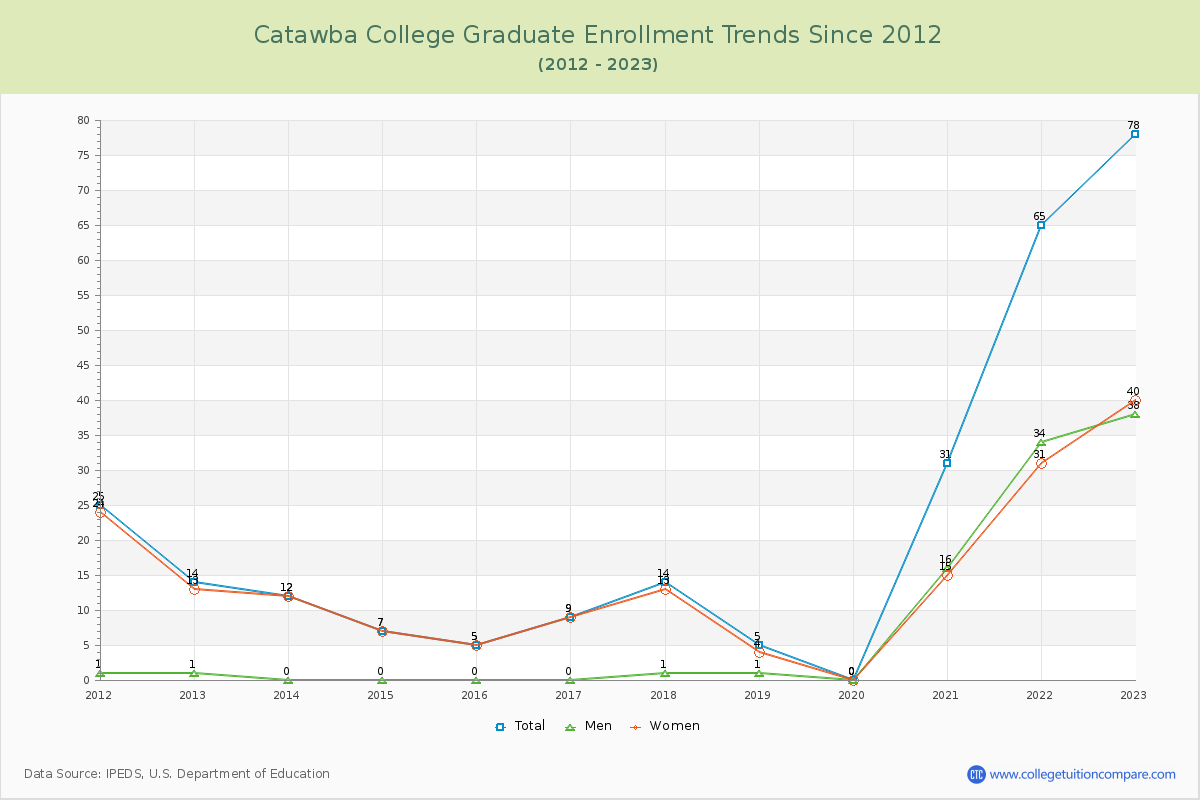
93.34% of total students is undergraduate students and 6.66% students is graduate students. The number of undergraduate students has decreased by 229 and the graduate enrollment has increased by 64 over past 10 years.
The female to male ratio is 1.10 to 1 and it means that there are similar numbers of female and male students enrolled in Catawba.
The following table and chart illustrate the changes in student population by gender at Catawba College since 2012.
| Year | Total | Undergraduate | Graduate | ||||
|---|---|---|---|---|---|---|---|
| Total | Men | Women | Total | Men | Women | ||
| 2012-13 | 1,337 | 1,323 | 640 | 683 | 14 | 1 | 13 |
| 2013-14 | 1,310 -27 | 1,298 -25 | 618 -22 | 680 -3 | 12 -2 | 0 -1 | 12 -1 |
| 2014-15 | 1,300 -10 | 1,293 -5 | 609 -9 | 684 4 | 7 -5 | 0 0 | 7 -5 |
| 2015-16 | 1,275 -25 | 1,270 -23 | 607 -2 | 663 -21 | 5 -2 | 0 0 | 5 -2 |
| 2016-17 | 1,306 31 | 1,297 27 | 600 -7 | 697 34 | 9 4 | 0 0 | 9 4 |
| 2017-18 | 1,336 30 | 1,322 25 | 617 17 | 705 8 | 14 5 | 1 1 | 13 4 |
| 2018-19 | 1,294 -42 | 1,289 -33 | 601 -16 | 688 -17 | 5 -9 | 1 0 | 4 -9 |
| 2019-20 | 1,324 30 | 1,324 35 | 598 -3 | 726 38 | 0 -5 | 0 -1 | 0 -4 |
| 2020-21 | 1,371 47 | 1,340 16 | 625 27 | 715 -11 | 31 31 | 16 16 | 15 15 |
| 2021-22 | 1,207 -164 | 1,142 -198 | 547 -78 | 595 -120 | 65 34 | 34 18 | 31 16 |
| 2022-23 | 1,172 -35 | 1,094 -48 | 519 -28 | 575 -20 | 78 13 | 38 4 | 40 9 |
| Average | 1,294 | 1,272 | 598 | 674 | 22 | 8 | 14 |