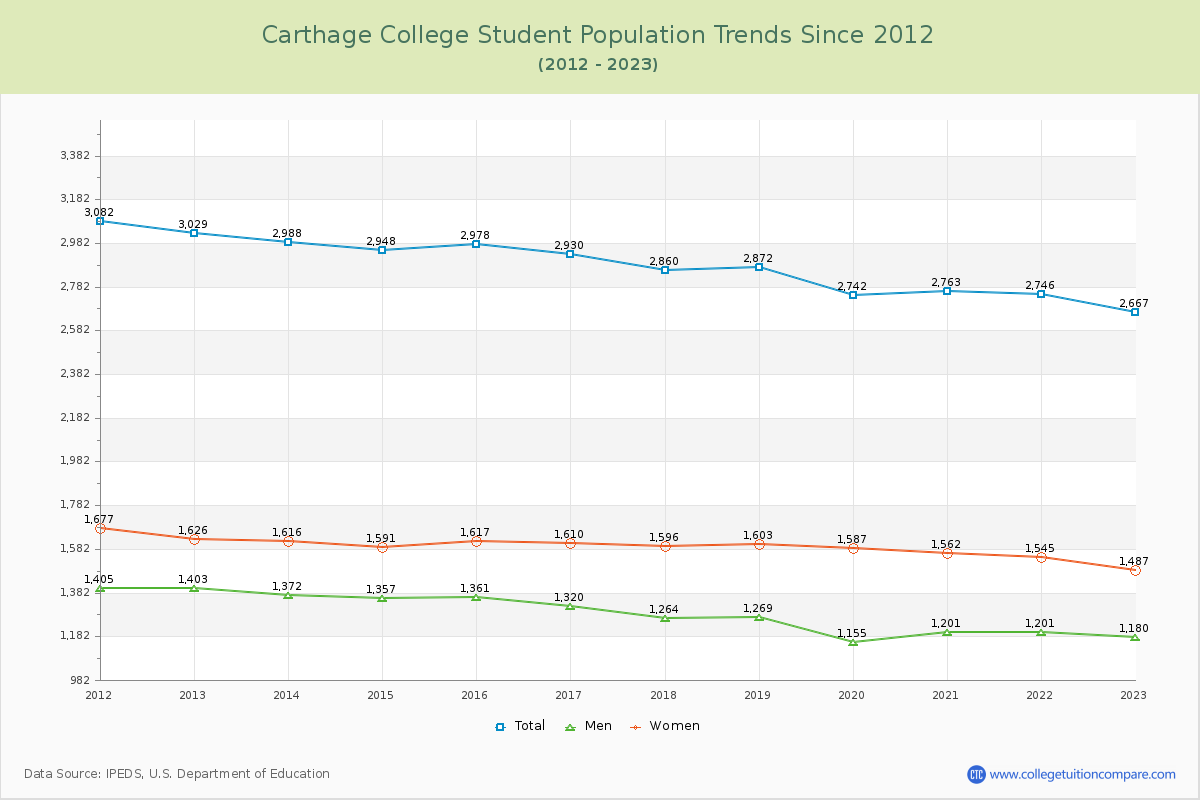
Student Population Changes
The average student population over the last 12 years is 2,866 where 2,667 students are attending the school for the academic year 2022-2023.
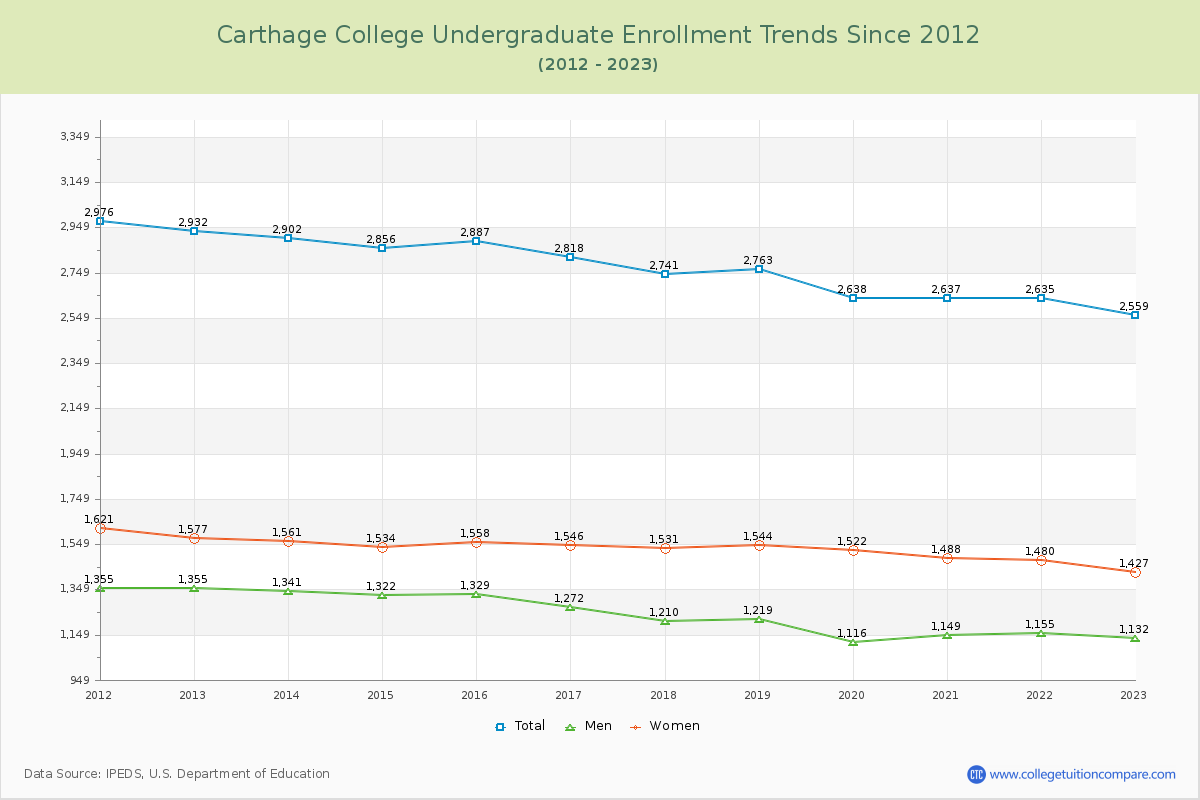
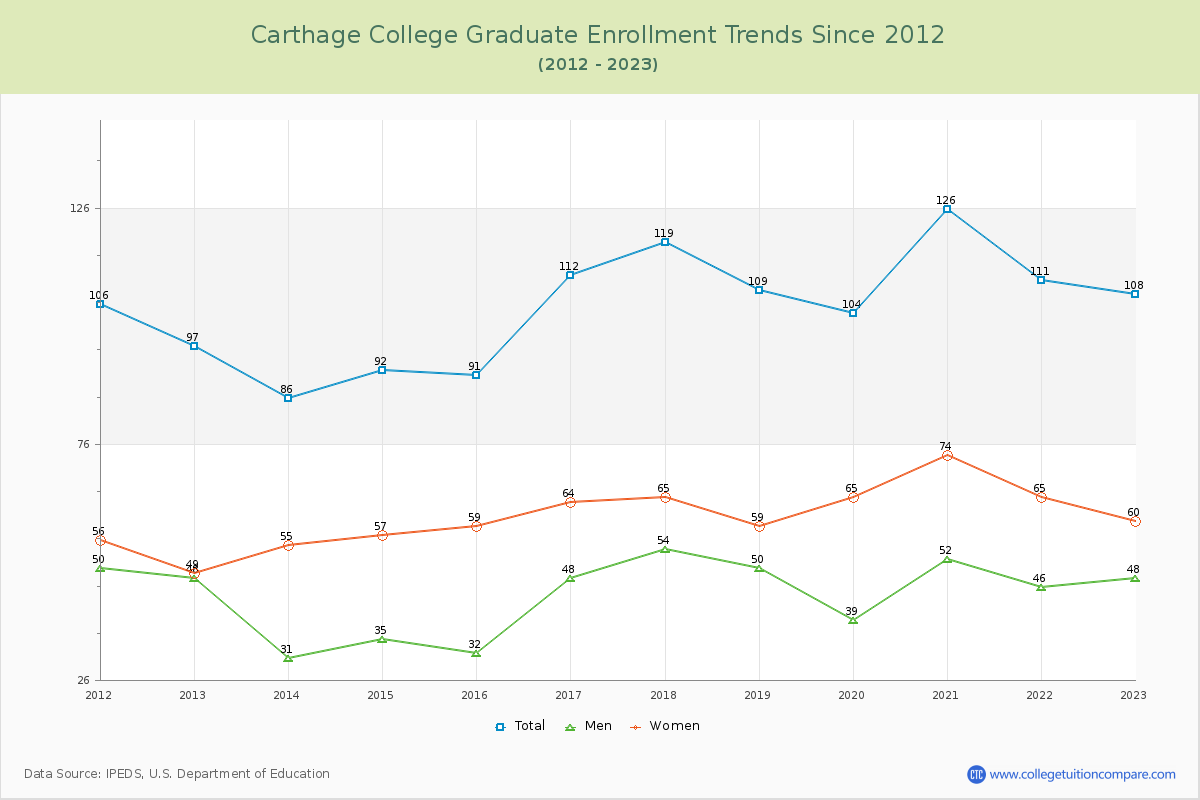
95.95% of total students is undergraduate students and 4.05% students is graduate students. The number of undergraduate students has decreased by 373 and the graduate enrollment has increased by 11 over past 10 years.
The female to male ratio is 1.26 to 1 and it means that there are slightly more female students enrolled in Carthage than male students.
The following table and chart illustrate the changes in student population by gender at Carthage College since 2012.
| Year | Total | Undergraduate | Graduate | ||||
|---|---|---|---|---|---|---|---|
| Total | Men | Women | Total | Men | Women | ||
| 2012-13 | 3,029 | 2,932 | 1,355 | 1,577 | 97 | 48 | 49 |
| 2013-14 | 2,988 -41 | 2,902 -30 | 1,341 -14 | 1,561 -16 | 86 -11 | 31 -17 | 55 6 |
| 2014-15 | 2,948 -40 | 2,856 -46 | 1,322 -19 | 1,534 -27 | 92 6 | 35 4 | 57 2 |
| 2015-16 | 2,978 30 | 2,887 31 | 1,329 7 | 1,558 24 | 91 -1 | 32 -3 | 59 2 |
| 2016-17 | 2,930 -48 | 2,818 -69 | 1,272 -57 | 1,546 -12 | 112 21 | 48 16 | 64 5 |
| 2017-18 | 2,860 -70 | 2,741 -77 | 1,210 -62 | 1,531 -15 | 119 7 | 54 6 | 65 1 |
| 2018-19 | 2,872 12 | 2,763 22 | 1,219 9 | 1,544 13 | 109 -10 | 50 -4 | 59 -6 |
| 2019-20 | 2,742 -130 | 2,638 -125 | 1,116 -103 | 1,522 -22 | 104 -5 | 39 -11 | 65 6 |
| 2020-21 | 2,763 21 | 2,637 -1 | 1,149 33 | 1,488 -34 | 126 22 | 52 13 | 74 9 |
| 2021-22 | 2,746 -17 | 2,635 -2 | 1,155 6 | 1,480 -8 | 111 -15 | 46 -6 | 65 -9 |
| 2022-23 | 2,667 -79 | 2,559 -76 | 1,132 -23 | 1,427 -53 | 108 -3 | 48 2 | 60 -5 |
| Average | 2,866 | 2,761 | 1,236 | 1,524 | 105 | 44 | 61 |