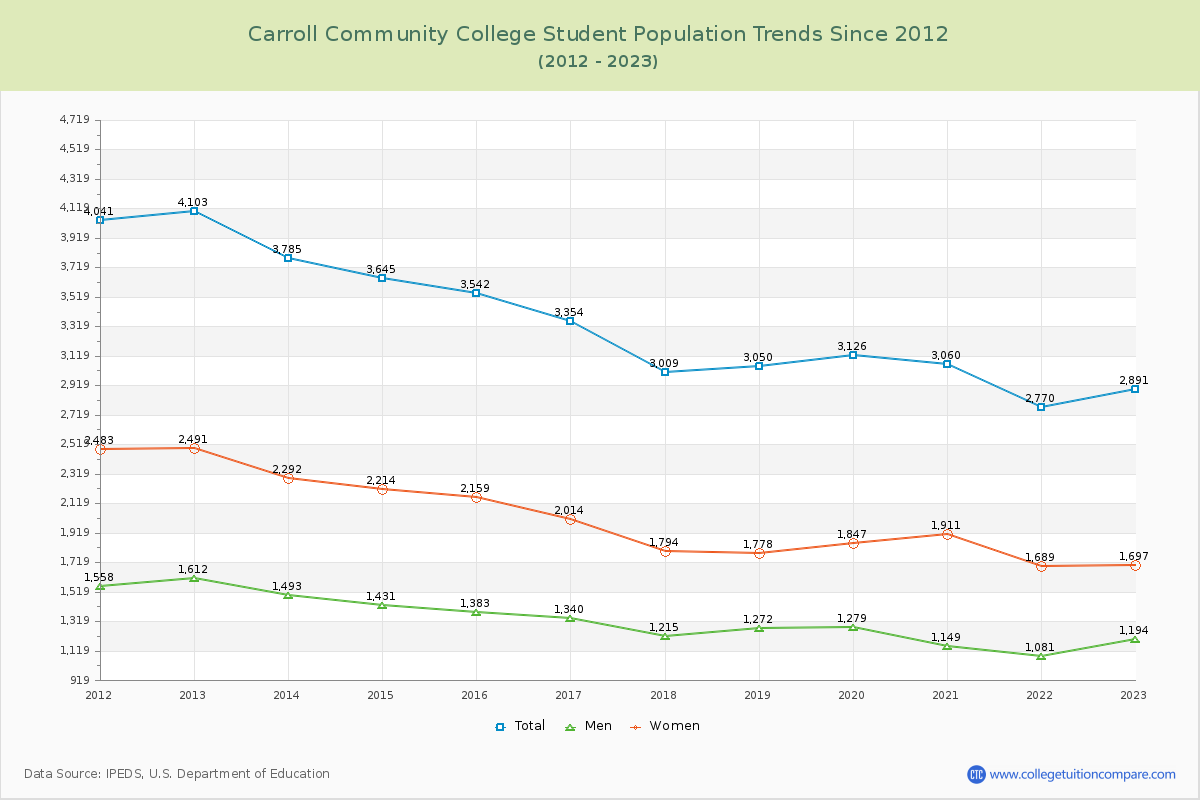
Student Population Changes
The average student population over the last 12 years is 3,303 where 2,891 students are attending the school for the academic year 2022-2023.
The female to male ratio is 1.42 to 1 and it means that there are more female students enrolled in Carroll CC than male students.
The following table and chart illustrate the changes in student population by gender at Carroll Community College since 2012.
| Year | Total | Men | Women |
|---|---|---|---|
| 2012-13 | 4,103 | 1,612 | 2,491 |
| 2013-14 | 3,785 -318 | 1,493 -119 | 2,292 -199 |
| 2014-15 | 3,645 -140 | 1,431 -62 | 2,214 -78 |
| 2015-16 | 3,542 -103 | 1,383 -48 | 2,159 -55 |
| 2016-17 | 3,354 -188 | 1,340 -43 | 2,014 -145 |
| 2017-18 | 3,009 -345 | 1,215 -125 | 1,794 -220 |
| 2018-19 | 3,050 41 | 1,272 57 | 1,778 -16 |
| 2019-20 | 3,126 76 | 1,279 7 | 1,847 69 |
| 2020-21 | 3,060 -66 | 1,149 -130 | 1,911 64 |
| 2021-22 | 2,770 -290 | 1,081 -68 | 1,689 -222 |
| 2022-23 | 2,891 121 | 1,194 113 | 1,697 8 |
| Average | 3,303 | 1,314 | 1,990 |