Enrollment Trends at Carrington College-Spokane

-60

Total Enrollment

106

Men

-166

Women

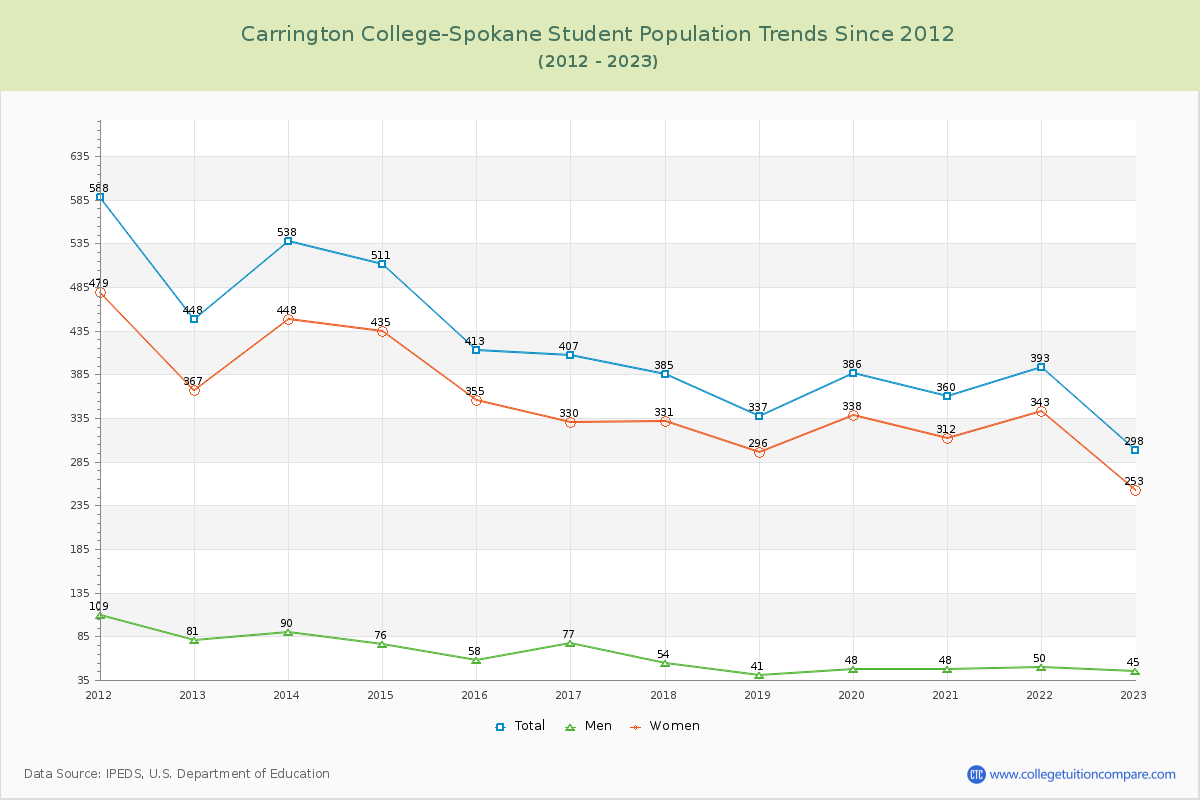
The student population at Carrington College-Spokane is 353 (all undergraduate). The number of students has decreased by 60 over the past decade.

The female to male ratio is 1.15 to 1 which means that female students enrolled slightly more than male students.

89 students enrolled in online degree program exclusively and the number of online students has increased by 888.89% since 2015.

Student Population Changes

The average student population over the last 11 years is 363 where 353 students are attending the school for the academic year 2024-2025.

The female to male ratio is 1.15 to 1 and it means that there are slightly more female students enrolled in Carrington College-Spokane than male students.

The following table and chart illustrate the changes in student population by gender at Carrington College-Spokane since 2015.

YearTotalMenWomen
2015-1641358355
2016-17407
-6
77
19
330
-25
2017-18385
-22
54
-23
331
1
2018-19337
-48
41
-13
296
-35
2019-20386
49
48
7
338
42
2020-21360
-26
48312
-26
2021-22393
33
50
2
343
31
2022-23298
-95
45
-5
253
-90
2023-24296
-2
95
50
201
-52
2024-25353
57
164
69
189
-12
Average36368295
Carrington College-Spokane Enrollment Trends Chart

Enrollment by Race/Ethnicity Changes

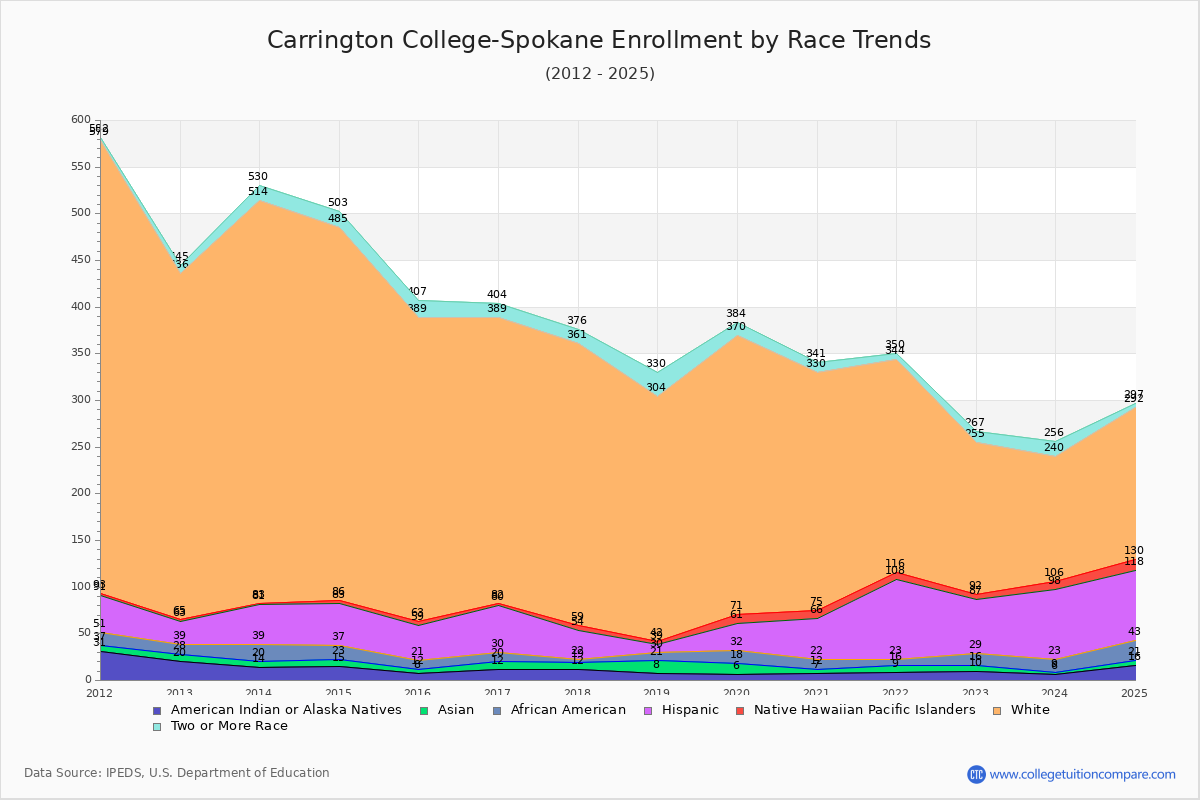
The percentage of white students is 45.89% and the percentage of black students is 6.23% at Carrington College-Spokane. 1.42% of enrolled students is Asian. Hispanic students comprise 21.25% of the student body.

Over the past 10 years, the racial composition has shifted. The percentage of white students decreased from 78.93% to 45.89%. Asian enrollment grew from 0.97% to 1.42%. Black student enrollment increased from 2.18% to 6.23%. Hispanic student representation expanded from 9.20% to 21.25%.

The overall racial diversity, measured by the Census Bureau Diversity Index, is 0.7368 which indicates that quite diverse. This increased from 0.3655 a decade ago, suggesting that racial diversity has improved.

The following table and chart illustrate the student population trends by race/ethnicity at Carrington College-Spokane over the past 11 years (2015-2025).

YearAmerican Indian or Native AmericanAsianBlackHispanicNative Hawaiian or Other Pacific IslanderWhiteTwo or More Races
2015-1684938432618
2016-171281050230715
2017-18127332530215
2018-1981399326226
2019-2061214291029914
2020-21751044925511
2021-229778582286
2022-231061358516312
2023-24631475813416
2024-251652275121625
Average971150724414
Carrington College-Spokane Enrollment by Race Trends Chart

Distance Learning (Online Courses) Enrollment Changes

89 students are enrolled in online degree programs exclusively for the academic year 2024-2025, which is 25% of total students. The number of online students has increased 888.89% since 2015. The following table and chart illustrate the changes in the online student population by enrolled type at Carrington College-Spokane from 2015 to 2025.

YearTotal EnrollmentOnline CompletelyEnrolled in Some Online CoursesNot Enrolled in Online Courses
2015-164139116288
2016-174079140258
2017-183857200178
2018-193370198139
2019-2038616118252
2020-2136019134207
2021-223933389271
2022-232985559184
2023-242969941156
2024-253538979185
Average36334117212

Ratings & Review

Share your experiences and thoughts about Carrington College-Spokane. It will be a great help to applicants and prospective students!