Enrollment Trends at Carl Sandburg

-479

Total Enrollment

-252

Men

-227

Women

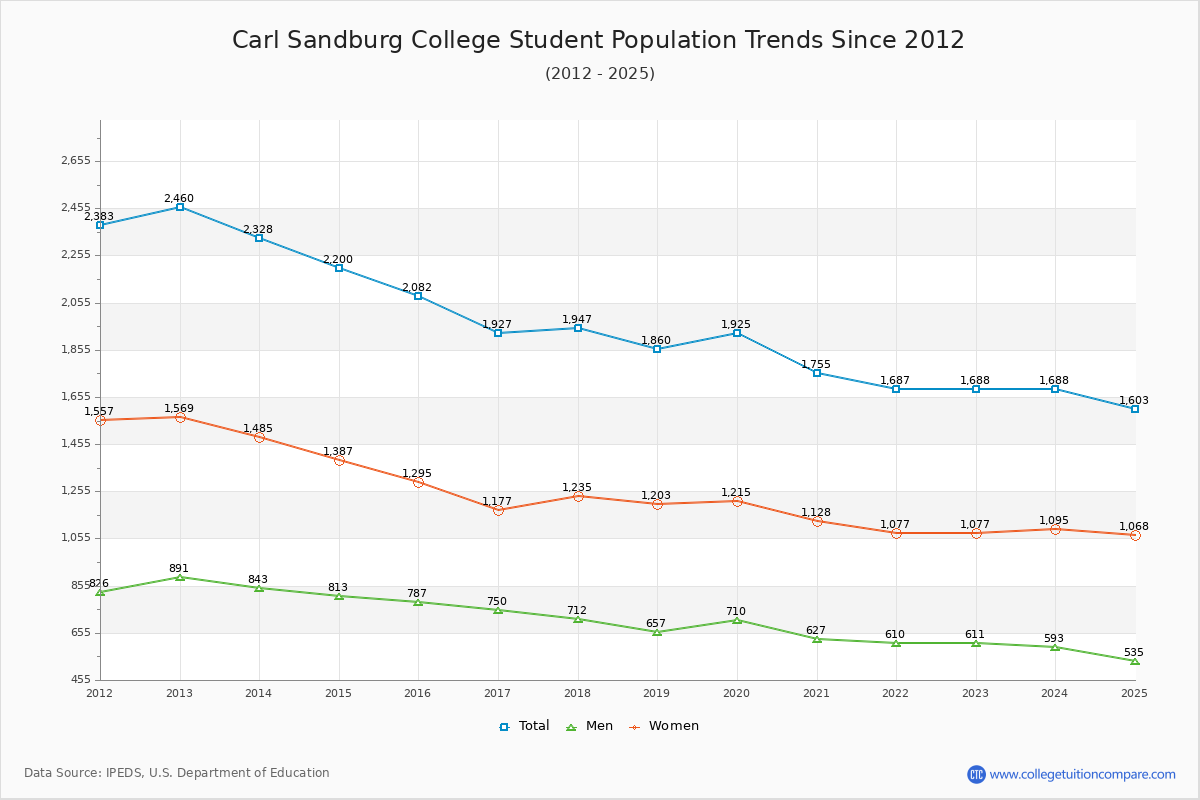
The student population at Carl Sandburg College is 1,603 (all undergraduate). The number of students has decreased by 479 over the past decade.

The female to male ratio is 2.00 to 1 which means that female students enrolled more than male students.

480 students enrolled in online degree program exclusively and the number of online students has increased by 136.45% since 2015.

Student Population Changes

The average student population over the last 11 years is 1,816 where 1,603 students are attending the school for the academic year 2024-2025.

The female to male ratio is 2.00 to 1 and it means that there are more female students enrolled in Carl Sandburg than male students.

The following table and chart illustrate the changes in student population by gender at Carl Sandburg College since 2015.

YearTotalMenWomen
2015-162,0827871,295
2016-171,927
-155
750
-37
1,177
-118
2017-181,947
20
712
-38
1,235
58
2018-191,860
-87
657
-55
1,203
-32
2019-201,925
65
710
53
1,215
12
2020-211,755
-170
627
-83
1,128
-87
2021-221,687
-68
610
-17
1,077
-51
2022-231,688
1
611
1
1,077
2023-241,688593
-18
1,095
18
2024-251,603
-85
535
-58
1,068
-27
Average1,8166591,157
Carl Sandburg College Enrollment Trends Chart

Enrollment by Race/Ethnicity Changes

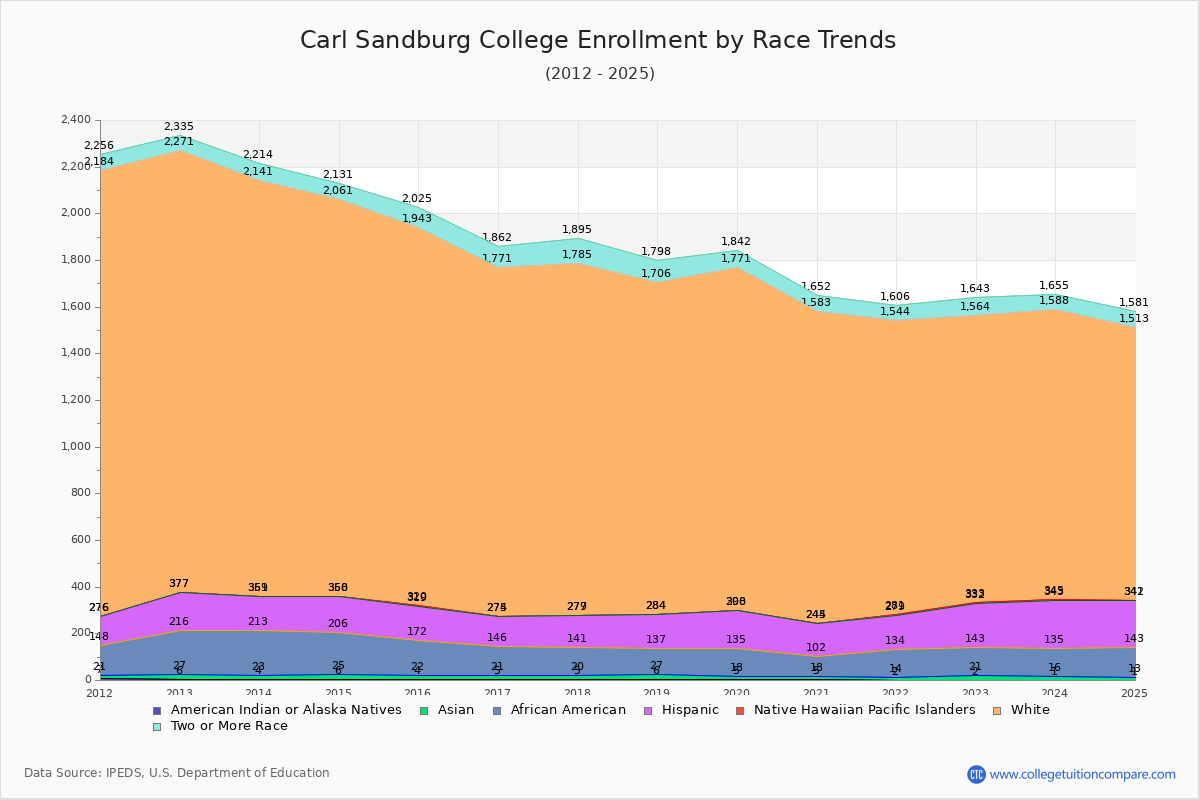
The percentage of white students is 73.05%. The percentage was 77.95% 10 years ago and Carl Sandburg still has a high percentage of white students. 0.75% of enrolled students is Asian and 8.11% is black students. Hispanic students comprise 12.35% of the student body.

Over the past 10 years, the racial composition has shifted. The percentage of white students decreased from 77.95% to 73.05%. Asian enrollment declined from 0.86% to 0.75%. Black student enrollment increased from 7.20% to 8.11%. Hispanic student representation expanded from 7.06% to 12.35%.

The overall racial diversity, measured by the Census Bureau Diversity Index, is 0.4427 which indicates that somewhat diverse. This increased from 0.3805 a decade ago, suggesting that racial diversity has improved.

The following table and chart illustrate the student population trends by race/ethnicity at Carl Sandburg College over the past 11 years (2015-2025).

YearAmerican Indian or Native AmericanAsianBlackHispanicNative Hawaiian or Other Pacific IslanderWhiteTwo or More Races
2015-1641815014711,62382
2016-1751612512811,49691
2017-1851512113621,506110
2018-1962111014701,42292
2019-2051311716321,47171
2020-215138414211,33869
2021-2221212014521,26362
2022-2321912218911,23179
2023-2411511920821,24367
2024-2511213019811,17168
Average41512016011,37679
Carl Sandburg College Enrollment by Race Trends Chart

Distance Learning (Online Courses) Enrollment Changes

480 students are enrolled in online degree programs exclusively for the academic year 2024-2025, which is 30% of total students. The number of online students has increased 136.45% since 2015. The following table and chart illustrate the changes in the online student population by enrolled type at Carl Sandburg College from 2015 to 2025.

YearTotal EnrollmentOnline CompletelyEnrolled in Some Online CoursesNot Enrolled in Online Courses
2015-162,0822035081,371
2016-171,9272195581,150
2017-181,9472865481,113
2018-191,8603005461,014
2019-201,9253605281,037
2020-211,755742723290
2021-221,687601673413
2022-231,688520600568
2023-241,688495595598
2024-251,603480554569
Average1,816421583812

Ratings & Review

Share your experiences and thoughts about Carl Sandburg College. It will be a great help to applicants and prospective students!