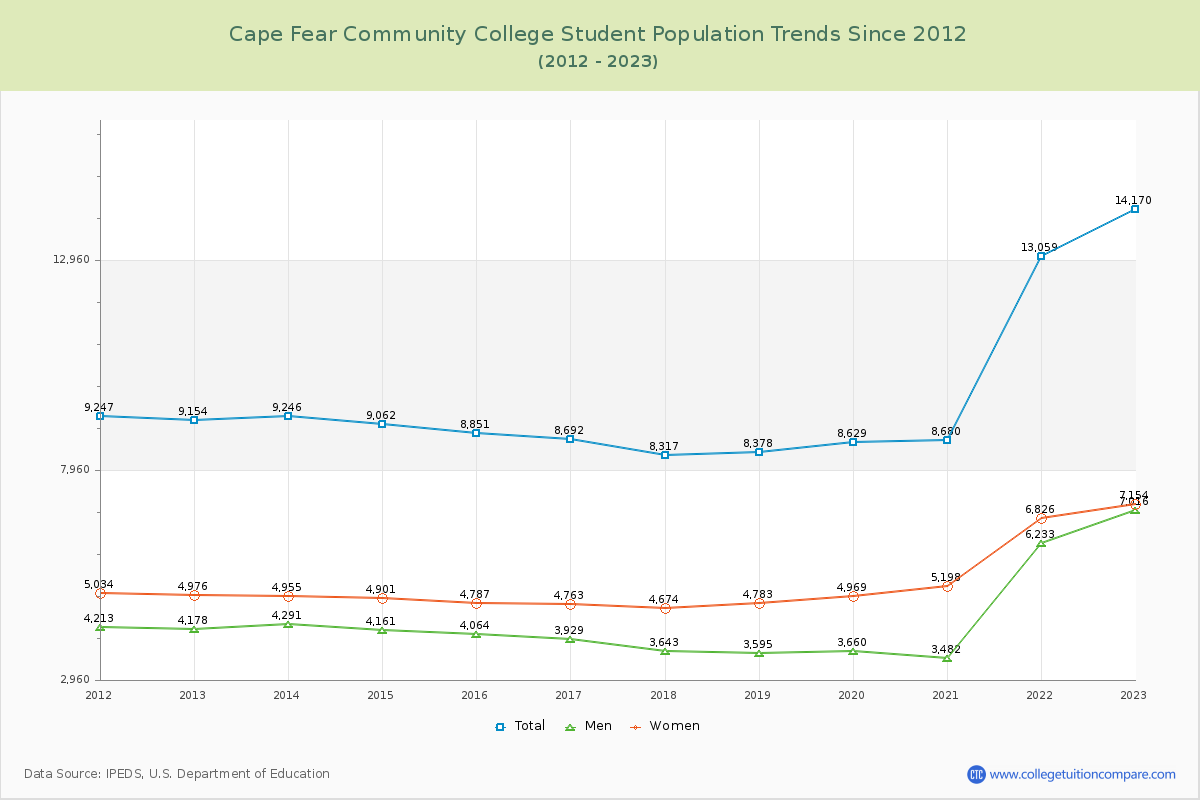
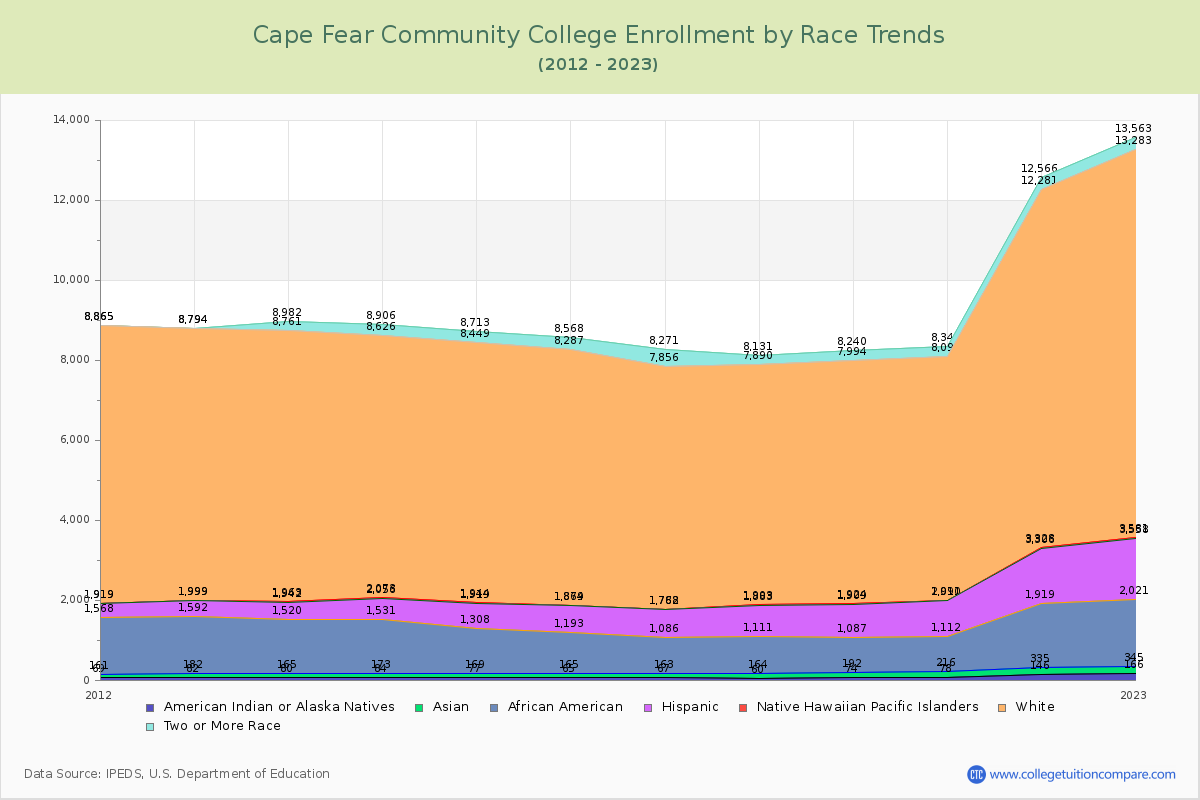
Student Population Changes
The average student population over the last 12 years is 9,658 where 14,170 students are attending the school for the academic year 2022-2023.
The female to male ratio is 1.02 to 1 and it means that there are similar numbers of female and male students enrolled in CFCC.
The following table and chart illustrate the changes in student population by gender at Cape Fear Community College since 2012.
| Year | Total | Men | Women |
|---|---|---|---|
| 2012-13 | 9,154 | 4,178 | 4,976 |
| 2013-14 | 9,246 92 | 4,291 113 | 4,955 -21 |
| 2014-15 | 9,062 -184 | 4,161 -130 | 4,901 -54 |
| 2015-16 | 8,851 -211 | 4,064 -97 | 4,787 -114 |
| 2016-17 | 8,692 -159 | 3,929 -135 | 4,763 -24 |
| 2017-18 | 8,317 -375 | 3,643 -286 | 4,674 -89 |
| 2018-19 | 8,378 61 | 3,595 -48 | 4,783 109 |
| 2019-20 | 8,629 251 | 3,660 65 | 4,969 186 |
| 2020-21 | 8,680 51 | 3,482 -178 | 5,198 229 |
| 2021-22 | 13,059 4,379 | 6,233 2,751 | 6,826 1,628 |
| 2022-23 | 14,170 1,111 | 7,016 783 | 7,154 328 |
| Average | 9,658 | 4,387 | 5,271 |