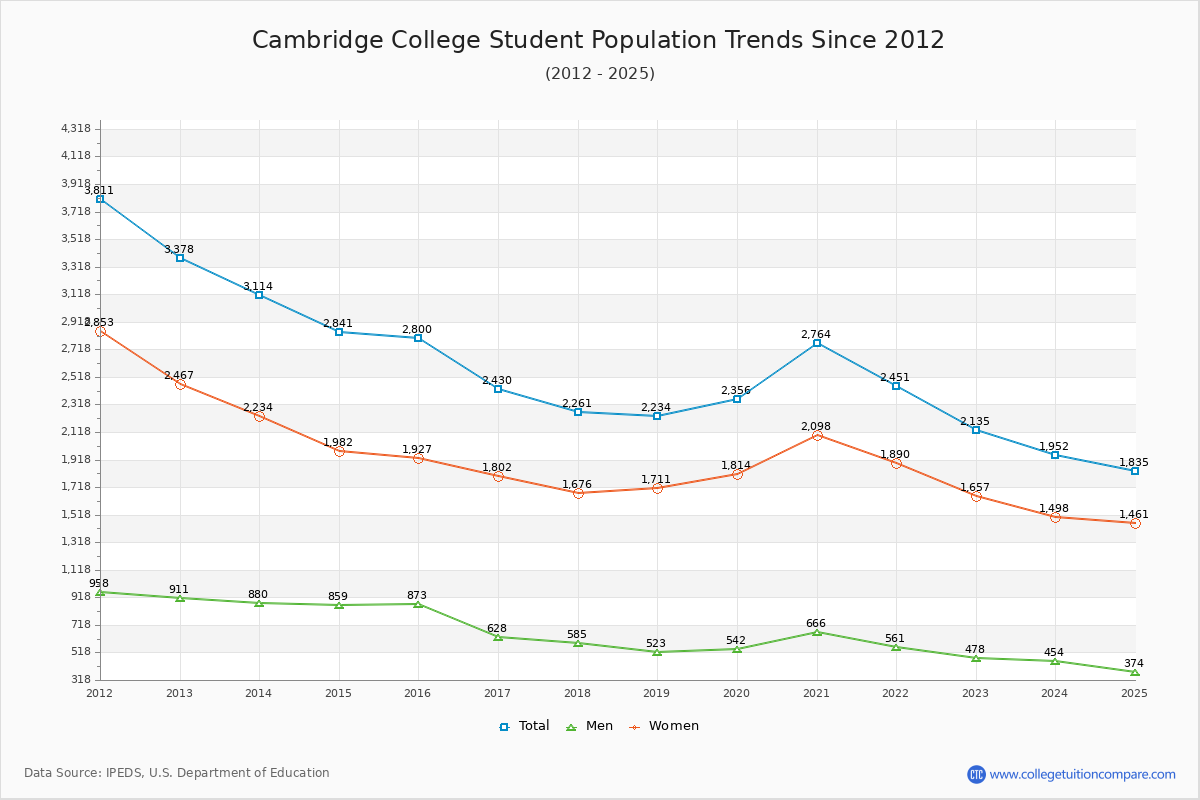
Student Population Changes
The average student population over the last 12 years is 2,615 where 2,135 students are attending the school for the academic year 2022-2023.
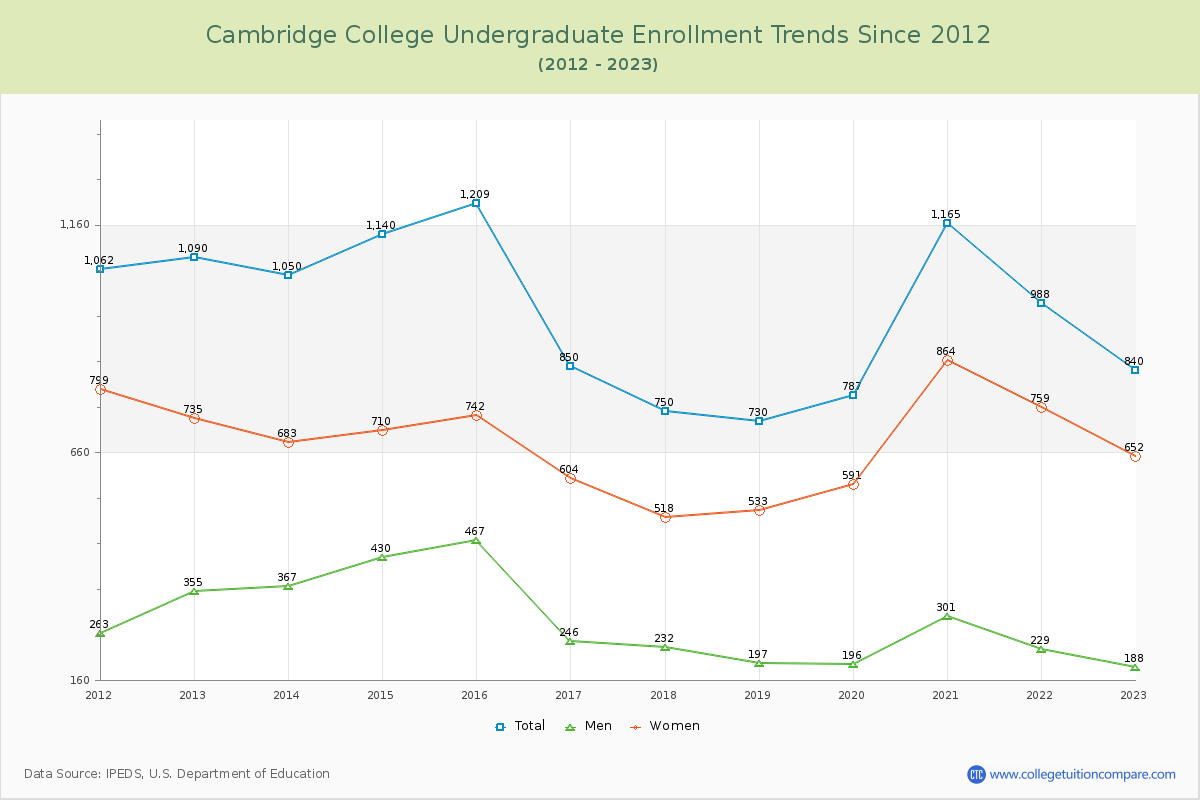
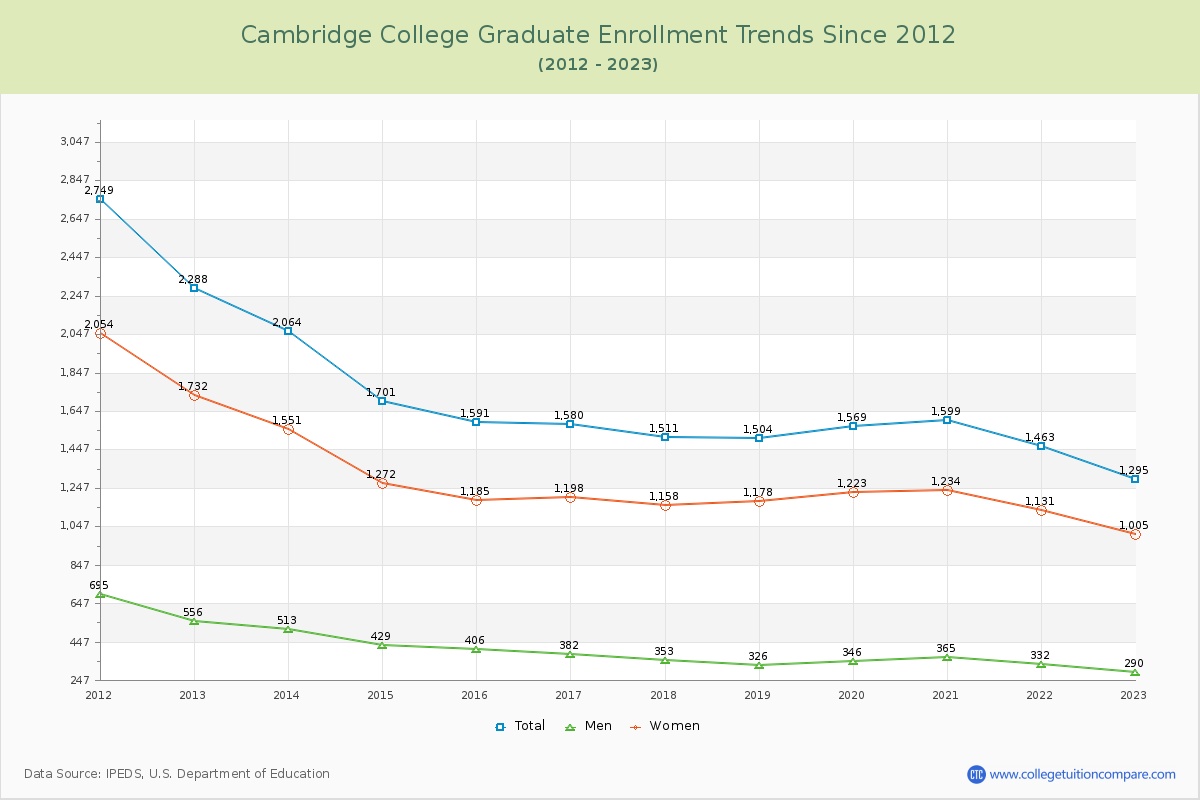
39.34% of total students is undergraduate students and 60.66% students is graduate students. The number of undergraduate students has decreased by 250 and the graduate enrollment has decreased by 993 over past 10 years.
The female to male ratio is 3.47 to 1 and it means that there are far more female students enrolled in Cambridge than male students.
The following table and chart illustrate the changes in student population by gender at Cambridge College since 2012.
| Year | Total | Undergraduate | Graduate | ||||
|---|---|---|---|---|---|---|---|
| Total | Men | Women | Total | Men | Women | ||
| 2012-13 | 3,378 | 1,090 | 355 | 735 | 2,288 | 556 | 1,732 |
| 2013-14 | 3,114 -264 | 1,050 -40 | 367 12 | 683 -52 | 2,064 -224 | 513 -43 | 1,551 -181 |
| 2014-15 | 2,841 -273 | 1,140 90 | 430 63 | 710 27 | 1,701 -363 | 429 -84 | 1,272 -279 |
| 2015-16 | 2,800 -41 | 1,209 69 | 467 37 | 742 32 | 1,591 -110 | 406 -23 | 1,185 -87 |
| 2016-17 | 2,430 -370 | 850 -359 | 246 -221 | 604 -138 | 1,580 -11 | 382 -24 | 1,198 13 |
| 2017-18 | 2,261 -169 | 750 -100 | 232 -14 | 518 -86 | 1,511 -69 | 353 -29 | 1,158 -40 |
| 2018-19 | 2,234 -27 | 730 -20 | 197 -35 | 533 15 | 1,504 -7 | 326 -27 | 1,178 20 |
| 2019-20 | 2,356 122 | 787 57 | 196 -1 | 591 58 | 1,569 65 | 346 20 | 1,223 45 |
| 2020-21 | 2,764 408 | 1,165 378 | 301 105 | 864 273 | 1,599 30 | 365 19 | 1,234 11 |
| 2021-22 | 2,451 -313 | 988 -177 | 229 -72 | 759 -105 | 1,463 -136 | 332 -33 | 1,131 -103 |
| 2022-23 | 2,135 -316 | 840 -148 | 188 -41 | 652 -107 | 1,295 -168 | 290 -42 | 1,005 -126 |
| Average | 2,615 | 964 | 292 | 672 | 1,651 | 391 | 1,261 |