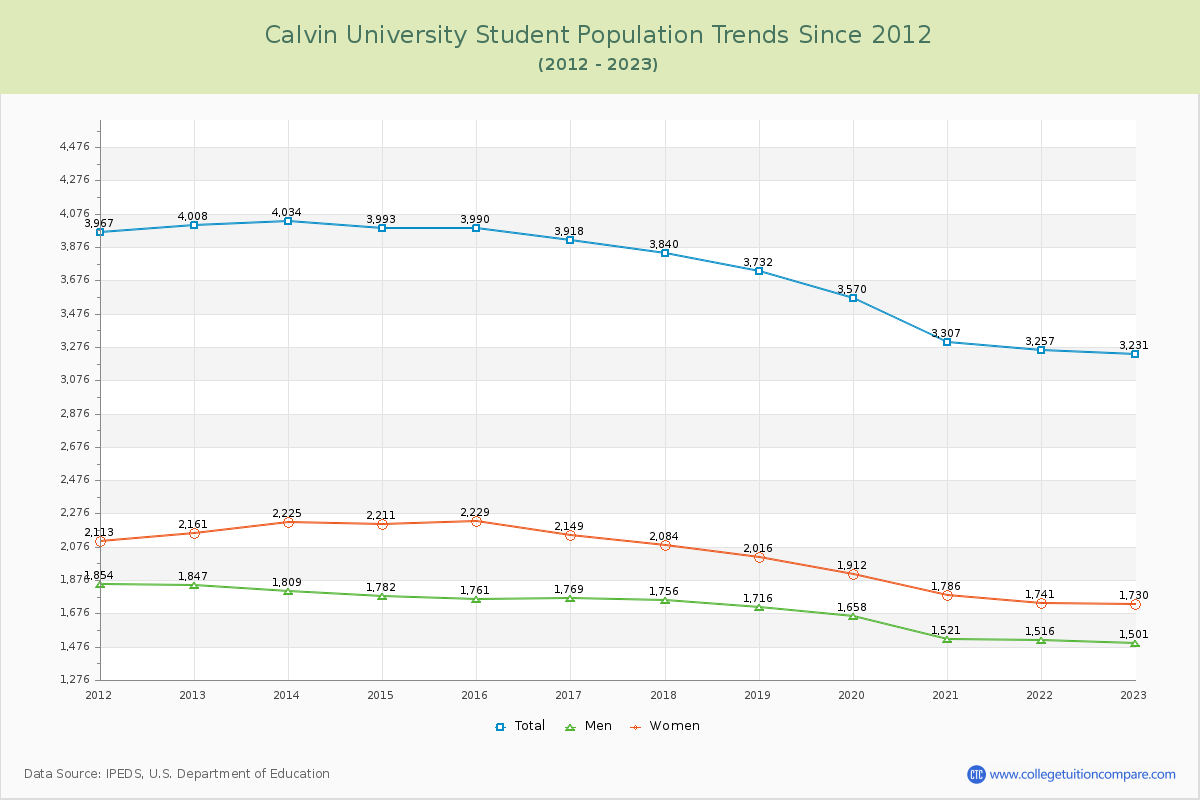
Student Population Changes
The average student population over the last 12 years is 3,716 where 3,231 students are attending the school for the academic year 2022-2023.
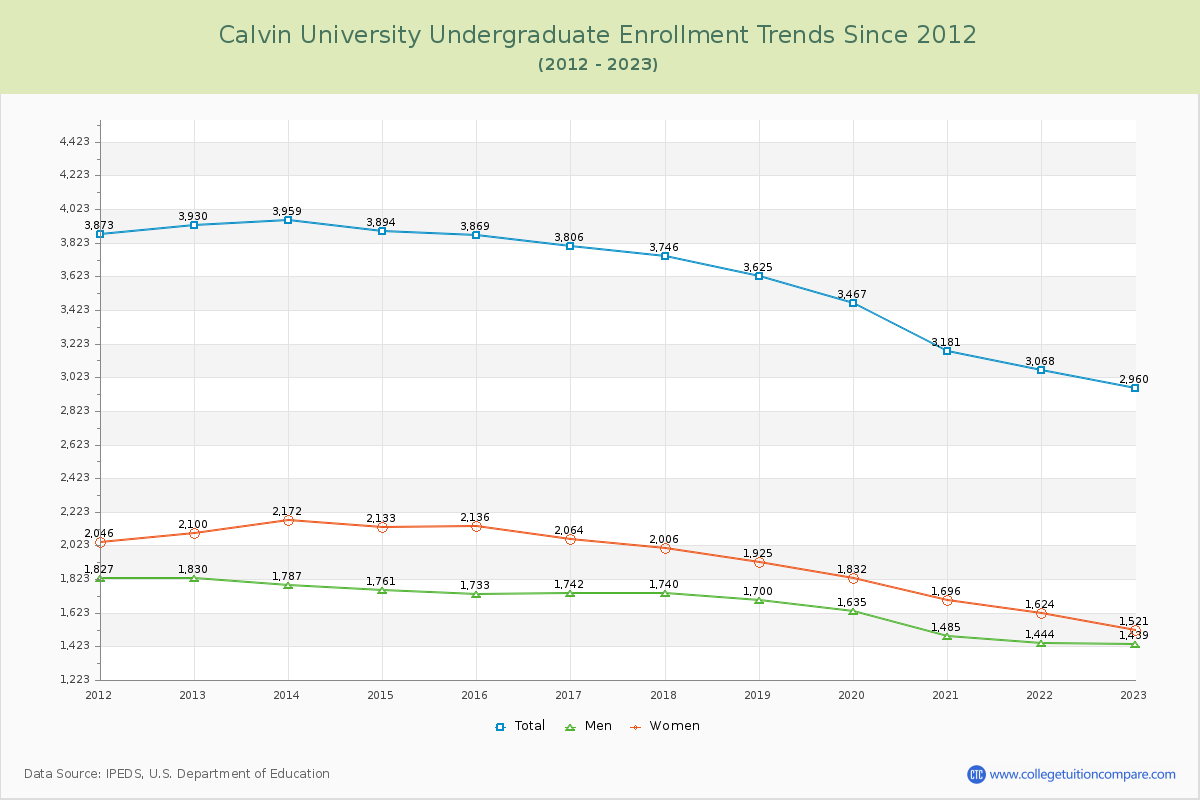
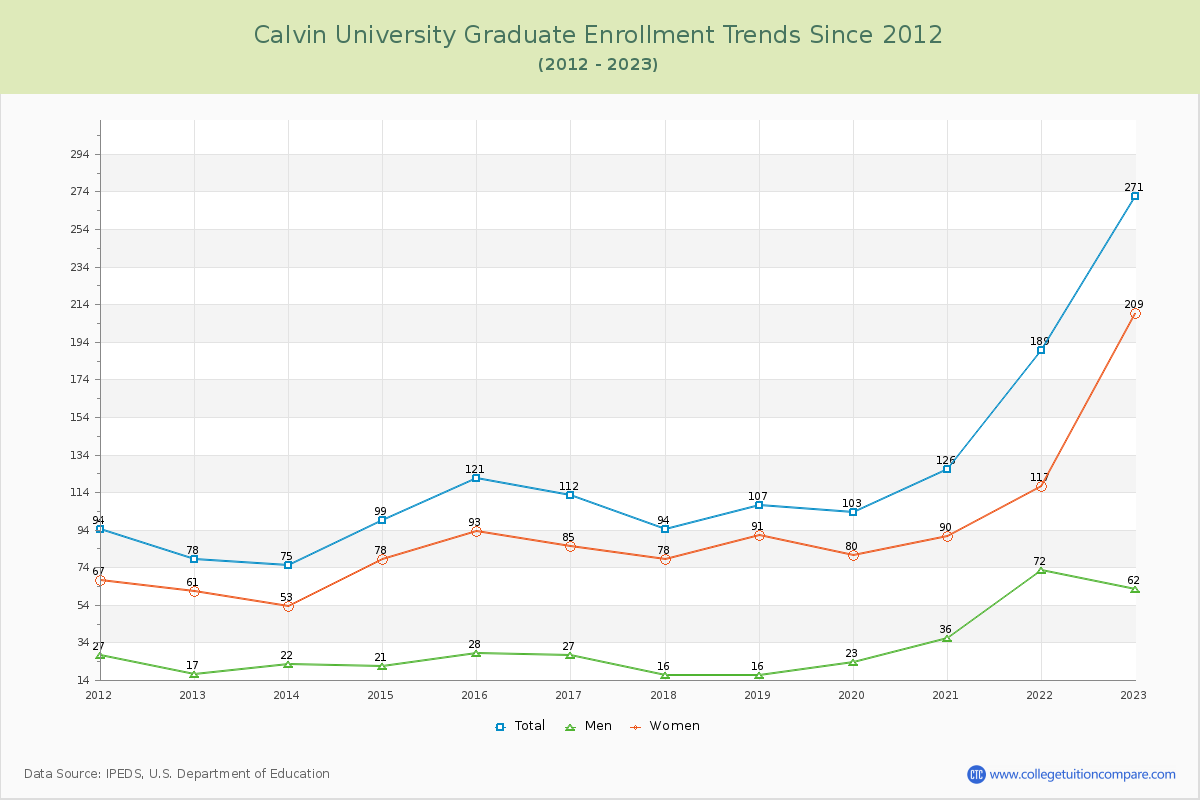
91.61% of total students is undergraduate students and 8.39% students is graduate students. The number of undergraduate students has decreased by 970 and the graduate enrollment has increased by 193 over past 10 years.
The female to male ratio is 1.15 to 1 and it means that there are slightly more female students enrolled in Calvin than male students.
The following table and chart illustrate the changes in student population by gender at Calvin University since 2012.
| Year | Total | Undergraduate | Graduate | ||||
|---|---|---|---|---|---|---|---|
| Total | Men | Women | Total | Men | Women | ||
| 2012-13 | 4,008 | 3,930 | 1,830 | 2,100 | 78 | 17 | 61 |
| 2013-14 | 4,034 26 | 3,959 29 | 1,787 -43 | 2,172 72 | 75 -3 | 22 5 | 53 -8 |
| 2014-15 | 3,993 -41 | 3,894 -65 | 1,761 -26 | 2,133 -39 | 99 24 | 21 -1 | 78 25 |
| 2015-16 | 3,990 -3 | 3,869 -25 | 1,733 -28 | 2,136 3 | 121 22 | 28 7 | 93 15 |
| 2016-17 | 3,918 -72 | 3,806 -63 | 1,742 9 | 2,064 -72 | 112 -9 | 27 -1 | 85 -8 |
| 2017-18 | 3,840 -78 | 3,746 -60 | 1,740 -2 | 2,006 -58 | 94 -18 | 16 -11 | 78 -7 |
| 2018-19 | 3,732 -108 | 3,625 -121 | 1,700 -40 | 1,925 -81 | 107 13 | 16 0 | 91 13 |
| 2019-20 | 3,570 -162 | 3,467 -158 | 1,635 -65 | 1,832 -93 | 103 -4 | 23 7 | 80 -11 |
| 2020-21 | 3,307 -263 | 3,181 -286 | 1,485 -150 | 1,696 -136 | 126 23 | 36 13 | 90 10 |
| 2021-22 | 3,257 -50 | 3,068 -113 | 1,444 -41 | 1,624 -72 | 189 63 | 72 36 | 117 27 |
| 2022-23 | 3,231 -26 | 2,960 -108 | 1,439 -5 | 1,521 -103 | 271 82 | 62 -10 | 209 92 |
| Average | 3,716 | 3,591 | 1,663 | 1,928 | 125 | 31 | 94 |