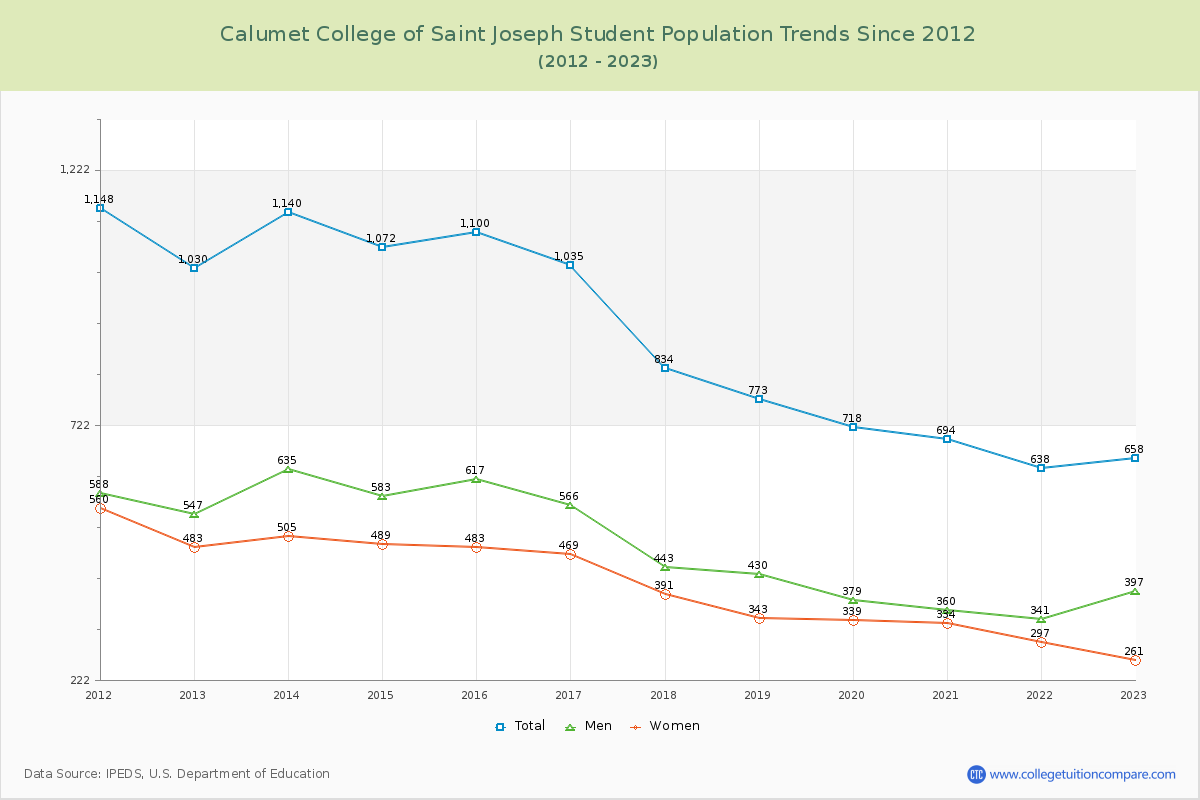
Student Population Changes
The average student population over the last 12 years is 881 where 658 students are attending the school for the academic year 2022-2023.
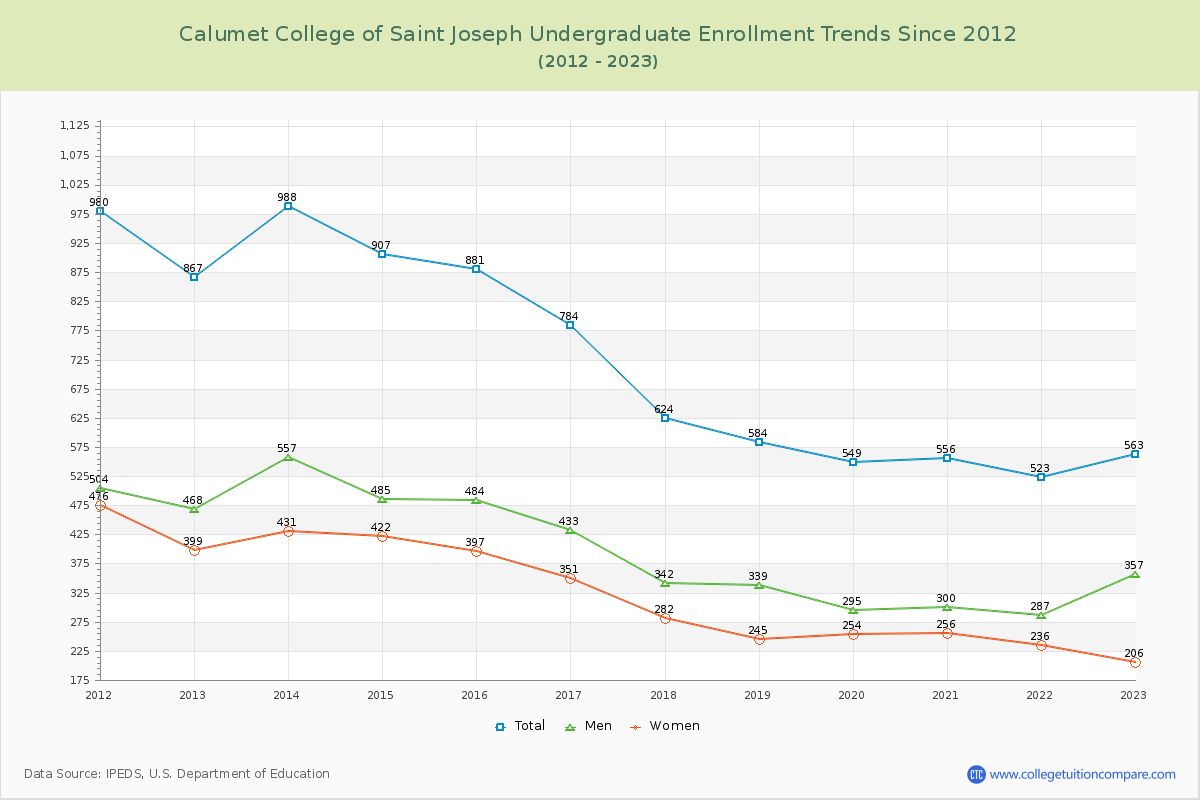
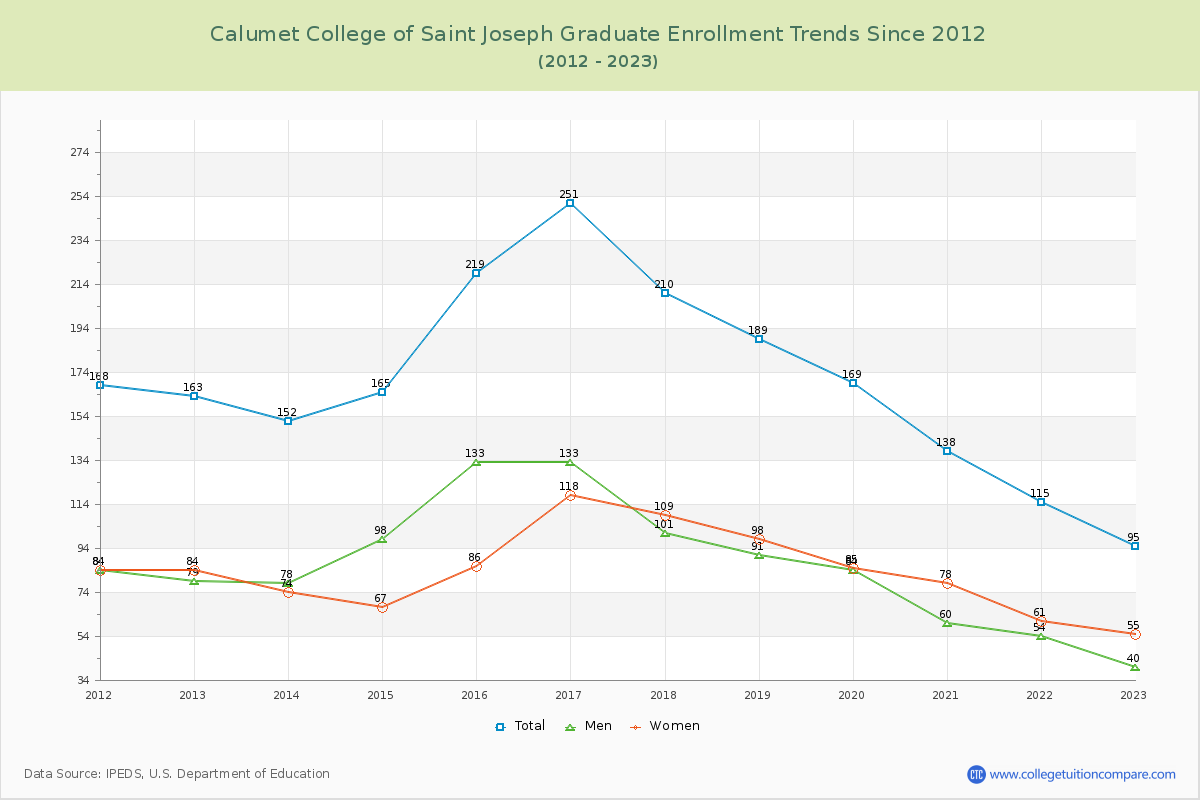
85.56% of total students is undergraduate students and 14.44% students is graduate students. The number of undergraduate students has decreased by 304 and the graduate enrollment has decreased by 68 over past 10 years.
The female to male ratio is 0.66 to 1 and it means that there are more male students enrolled in CCSJ than female students.
The following table and chart illustrate the changes in student population by gender at Calumet College of Saint Joseph since 2012.
| Year | Total | Undergraduate | Graduate | ||||
|---|---|---|---|---|---|---|---|
| Total | Men | Women | Total | Men | Women | ||
| 2012-13 | 1,030 | 867 | 468 | 399 | 163 | 79 | 84 |
| 2013-14 | 1,140 110 | 988 121 | 557 89 | 431 32 | 152 -11 | 78 -1 | 74 -10 |
| 2014-15 | 1,072 -68 | 907 -81 | 485 -72 | 422 -9 | 165 13 | 98 20 | 67 -7 |
| 2015-16 | 1,100 28 | 881 -26 | 484 -1 | 397 -25 | 219 54 | 133 35 | 86 19 |
| 2016-17 | 1,035 -65 | 784 -97 | 433 -51 | 351 -46 | 251 32 | 133 0 | 118 32 |
| 2017-18 | 834 -201 | 624 -160 | 342 -91 | 282 -69 | 210 -41 | 101 -32 | 109 -9 |
| 2018-19 | 773 -61 | 584 -40 | 339 -3 | 245 -37 | 189 -21 | 91 -10 | 98 -11 |
| 2019-20 | 718 -55 | 549 -35 | 295 -44 | 254 9 | 169 -20 | 84 -7 | 85 -13 |
| 2020-21 | 694 -24 | 556 7 | 300 5 | 256 2 | 138 -31 | 60 -24 | 78 -7 |
| 2021-22 | 638 -56 | 523 -33 | 287 -13 | 236 -20 | 115 -23 | 54 -6 | 61 -17 |
| 2022-23 | 658 20 | 563 40 | 357 70 | 206 -30 | 95 -20 | 40 -14 | 55 -6 |
| Average | 881 | 711 | 395 | 316 | 170 | 86 | 83 |