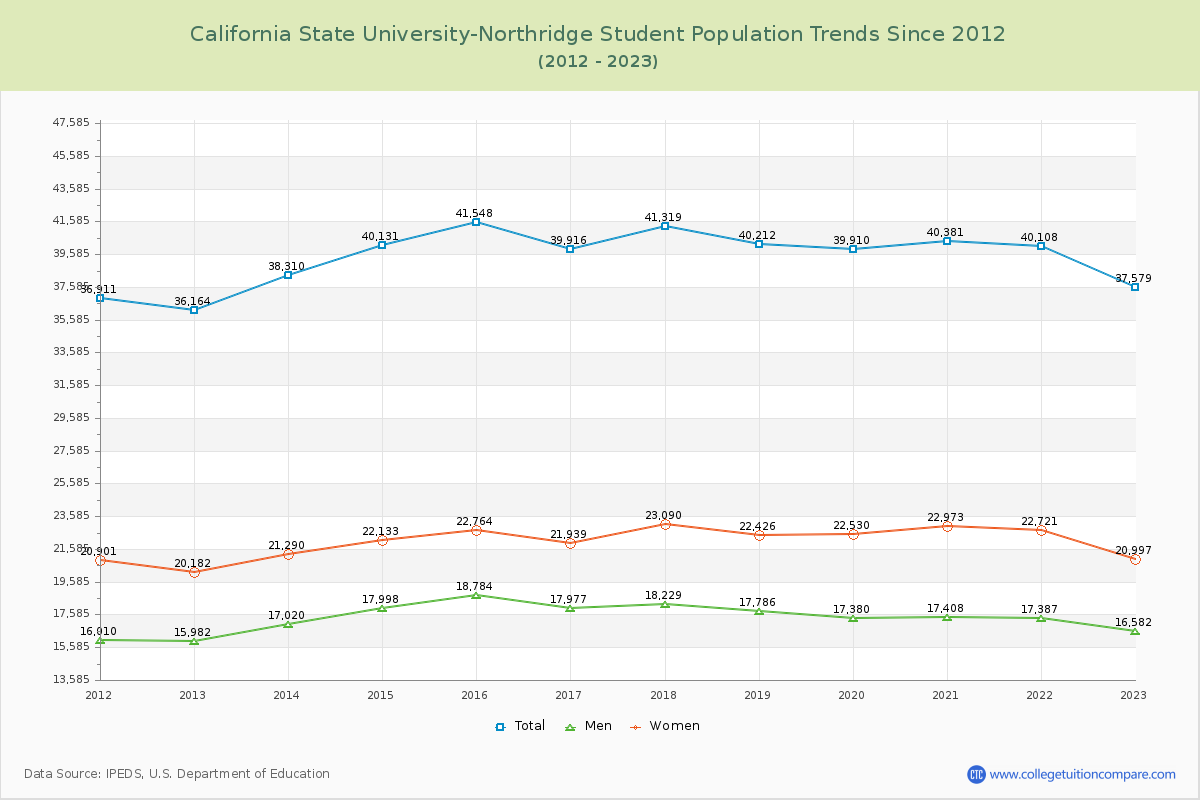
Student Population Changes
The average student population over the last 12 years is 39,598 where 37,579 students are attending the school for the academic year 2022-2023.
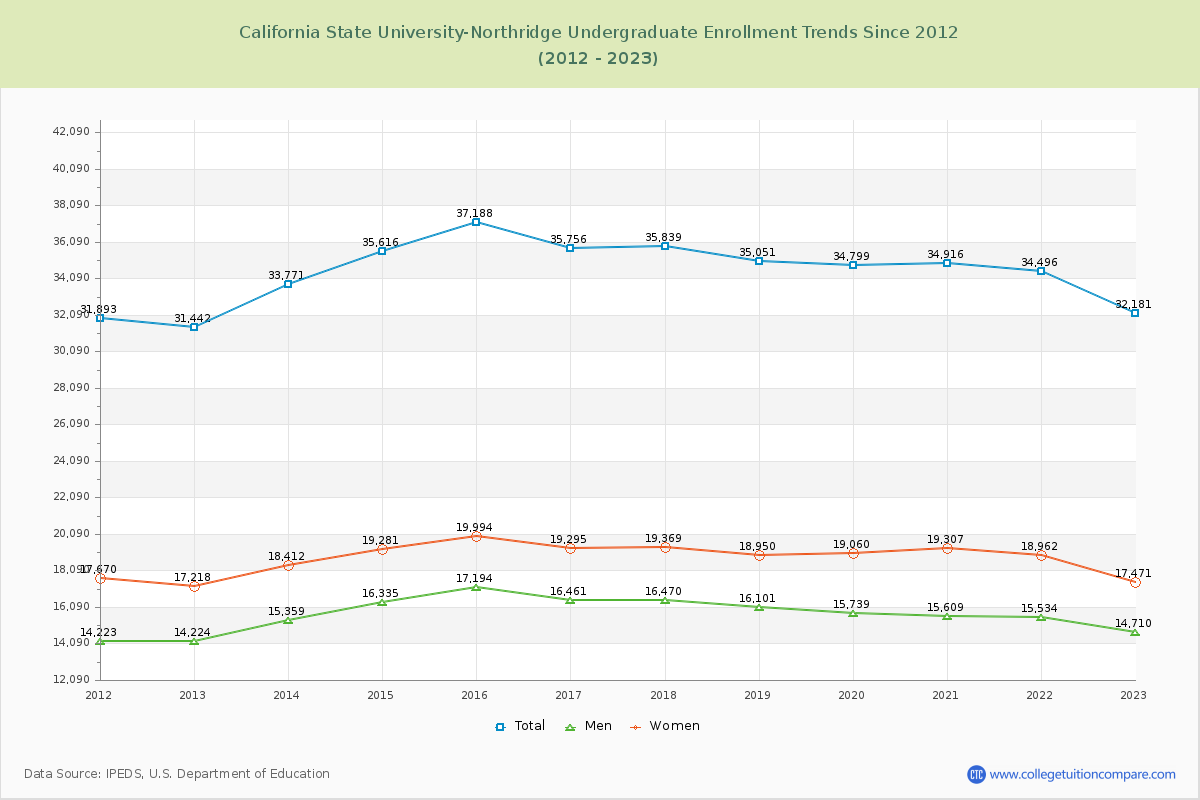
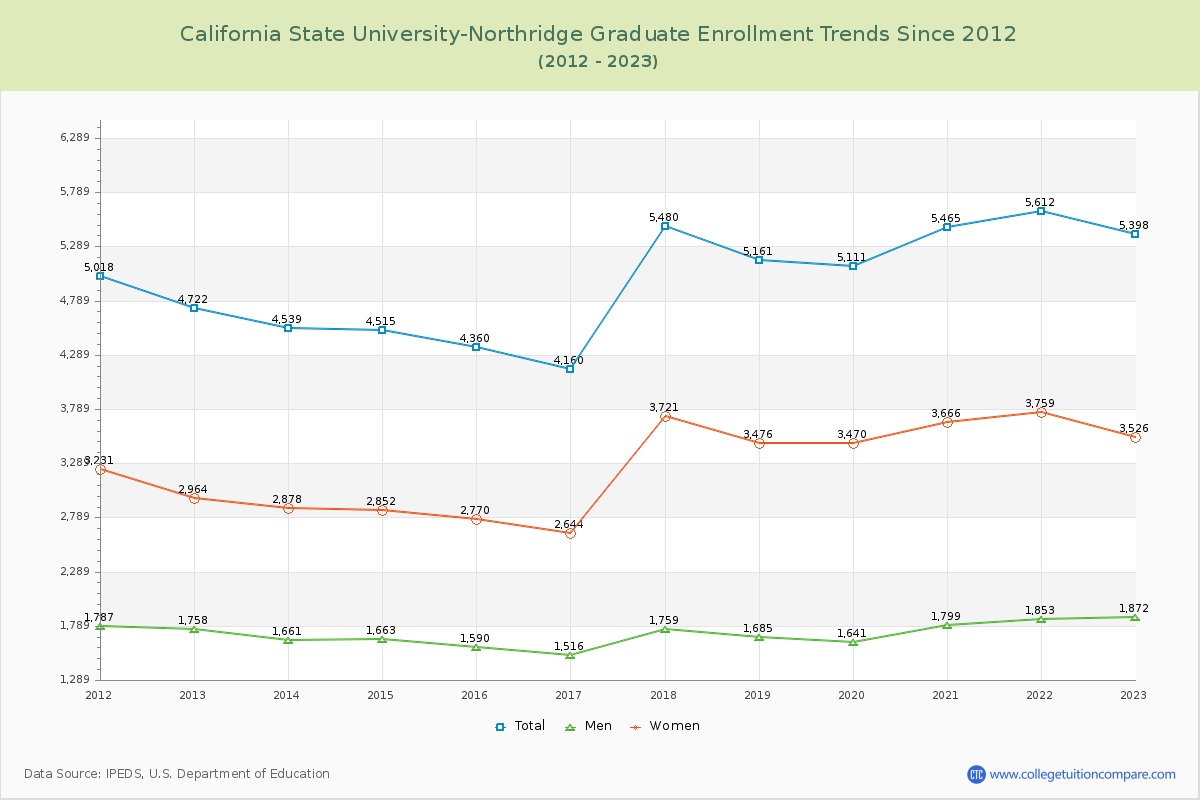
85.64% of total students is undergraduate students and 14.36% students is graduate students. The number of undergraduate students has increased by 739 and the graduate enrollment has increased by 676 over past 10 years.
The female to male ratio is 1.27 to 1 and it means that there are slightly more female students enrolled in CSUN than male students.
The following table and chart illustrate the changes in student population by gender at California State University-Northridge since 2012.
| Year | Total | Undergraduate | Graduate | ||||
|---|---|---|---|---|---|---|---|
| Total | Men | Women | Total | Men | Women | ||
| 2012-13 | 36,164 | 31,442 | 14,224 | 17,218 | 4,722 | 1,758 | 2,964 |
| 2013-14 | 38,310 2,146 | 33,771 2,329 | 15,359 1,135 | 18,412 1,194 | 4,539 -183 | 1,661 -97 | 2,878 -86 |
| 2014-15 | 40,131 1,821 | 35,616 1,845 | 16,335 976 | 19,281 869 | 4,515 -24 | 1,663 2 | 2,852 -26 |
| 2015-16 | 41,548 1,417 | 37,188 1,572 | 17,194 859 | 19,994 713 | 4,360 -155 | 1,590 -73 | 2,770 -82 |
| 2016-17 | 39,916 -1,632 | 35,756 -1,432 | 16,461 -733 | 19,295 -699 | 4,160 -200 | 1,516 -74 | 2,644 -126 |
| 2017-18 | 41,319 1,403 | 35,839 83 | 16,470 9 | 19,369 74 | 5,480 1,320 | 1,759 243 | 3,721 1,077 |
| 2018-19 | 40,212 -1,107 | 35,051 -788 | 16,101 -369 | 18,950 -419 | 5,161 -319 | 1,685 -74 | 3,476 -245 |
| 2019-20 | 39,910 -302 | 34,799 -252 | 15,739 -362 | 19,060 110 | 5,111 -50 | 1,641 -44 | 3,470 -6 |
| 2020-21 | 40,381 471 | 34,916 117 | 15,609 -130 | 19,307 247 | 5,465 354 | 1,799 158 | 3,666 196 |
| 2021-22 | 40,108 -273 | 34,496 -420 | 15,534 -75 | 18,962 -345 | 5,612 147 | 1,853 54 | 3,759 93 |
| 2022-23 | 37,579 -2,529 | 32,181 -2,315 | 14,710 -824 | 17,471 -1,491 | 5,398 -214 | 1,872 19 | 3,526 -233 |
| Average | 39,598 | 34,641 | 15,794 | 18,847 | 4,957 | 1,709 | 3,248 |