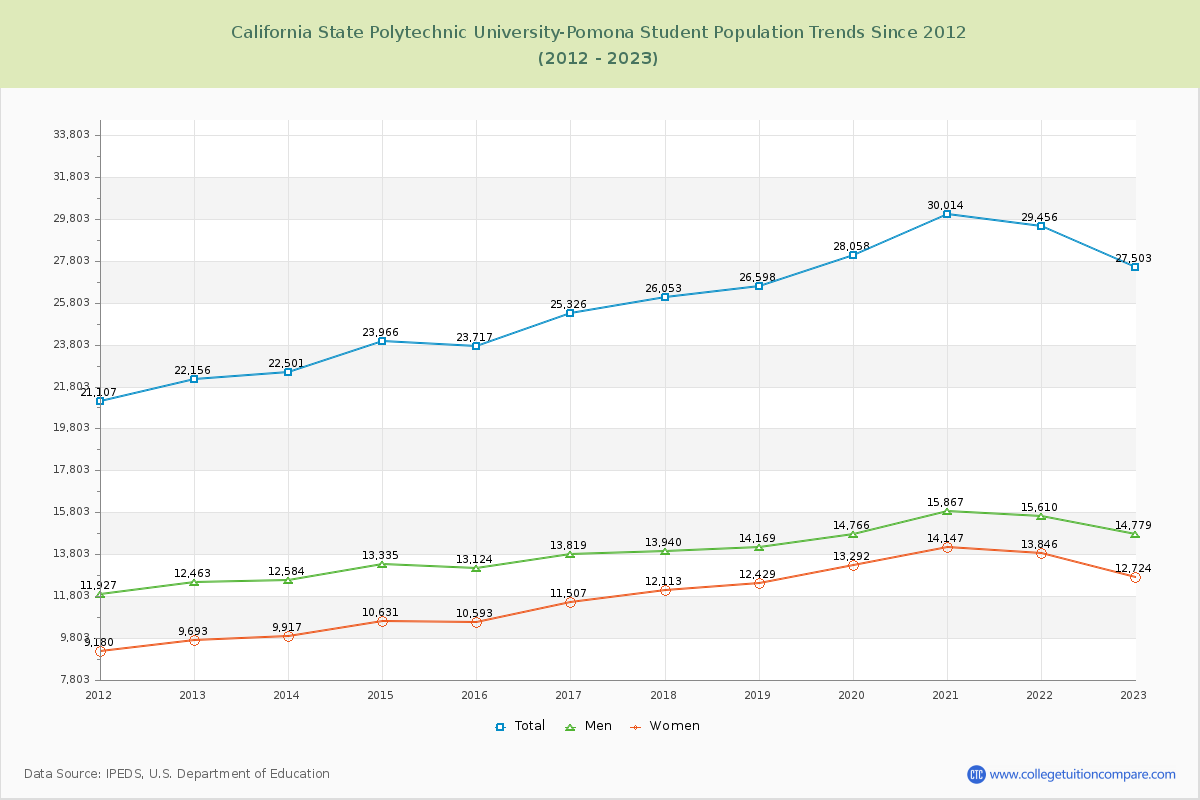
Student Population Changes
The average student population over the last 12 years is 25,941 where 27,503 students are attending the school for the academic year 2022-2023.
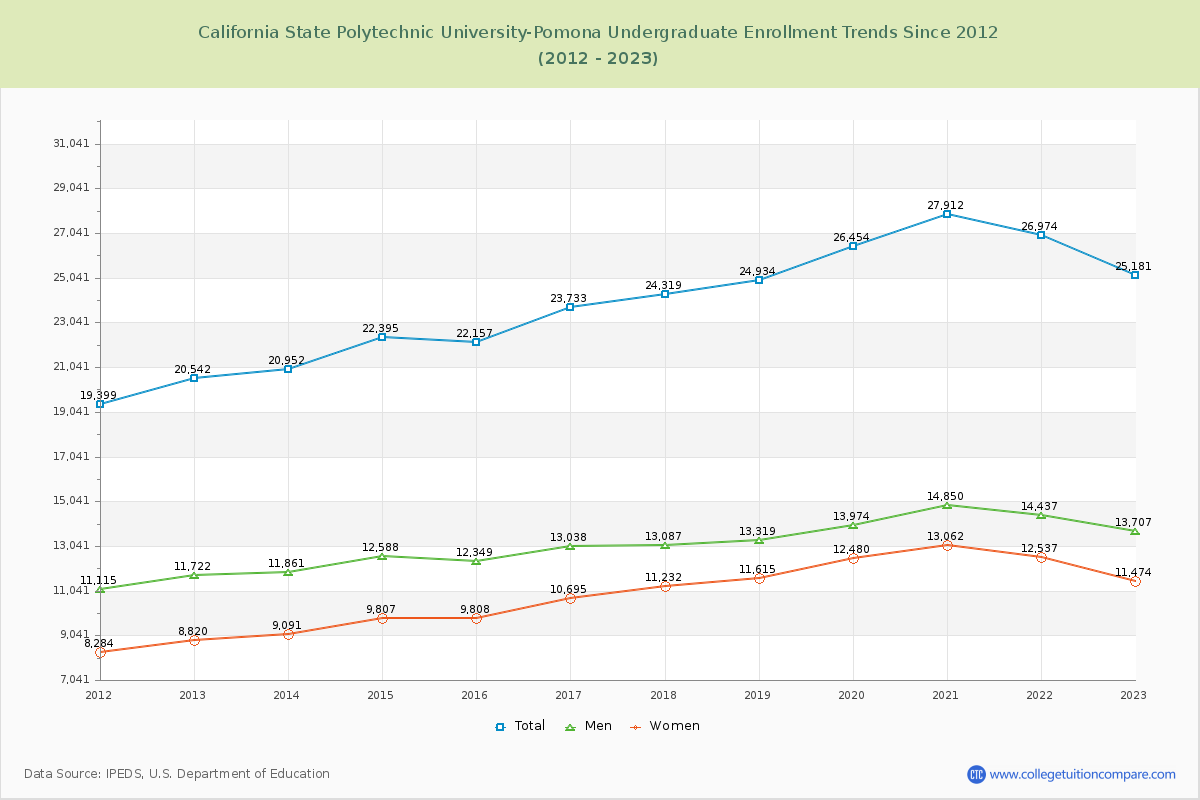
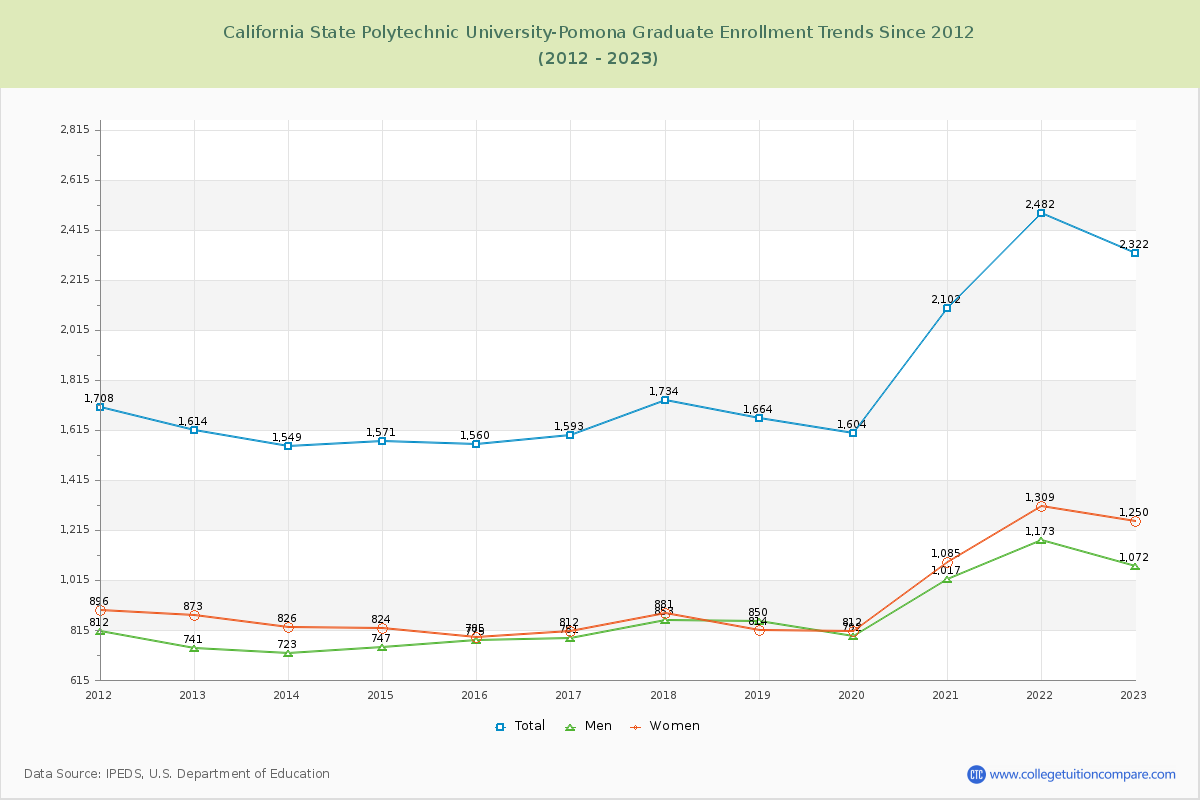
91.56% of total students is undergraduate students and 8.44% students is graduate students. The number of undergraduate students has increased by 4,639 and the graduate enrollment has increased by 708 over past 10 years.
The female to male ratio is 0.86 to 1 and it means that there are slightly more male students enrolled in California State Polytechnic University-Pomona than female students.
The following table and chart illustrate the changes in student population by gender at California State Polytechnic University-Pomona since 2012.
| Year | Total | Undergraduate | Graduate | ||||
|---|---|---|---|---|---|---|---|
| Total | Men | Women | Total | Men | Women | ||
| 2012-13 | 22,156 | 20,542 | 11,722 | 8,820 | 1,614 | 741 | 873 |
| 2013-14 | 22,501 345 | 20,952 410 | 11,861 139 | 9,091 271 | 1,549 -65 | 723 -18 | 826 -47 |
| 2014-15 | 23,966 1,465 | 22,395 1,443 | 12,588 727 | 9,807 716 | 1,571 22 | 747 24 | 824 -2 |
| 2015-16 | 23,717 -249 | 22,157 -238 | 12,349 -239 | 9,808 1 | 1,560 -11 | 775 28 | 785 -39 |
| 2016-17 | 25,326 1,609 | 23,733 1,576 | 13,038 689 | 10,695 887 | 1,593 33 | 781 6 | 812 27 |
| 2017-18 | 26,053 727 | 24,319 586 | 13,087 49 | 11,232 537 | 1,734 141 | 853 72 | 881 69 |
| 2018-19 | 26,598 545 | 24,934 615 | 13,319 232 | 11,615 383 | 1,664 -70 | 850 -3 | 814 -67 |
| 2019-20 | 28,058 1,460 | 26,454 1,520 | 13,974 655 | 12,480 865 | 1,604 -60 | 792 -58 | 812 -2 |
| 2020-21 | 30,014 1,956 | 27,912 1,458 | 14,850 876 | 13,062 582 | 2,102 498 | 1,017 225 | 1,085 273 |
| 2021-22 | 29,456 -558 | 26,974 -938 | 14,437 -413 | 12,537 -525 | 2,482 380 | 1,173 156 | 1,309 224 |
| 2022-23 | 27,503 -1,953 | 25,181 -1,793 | 13,707 -730 | 11,474 -1,063 | 2,322 -160 | 1,072 -101 | 1,250 -59 |
| Average | 25,941 | 24,141 | 13,176 | 10,966 | 1,800 | 866 | 934 |