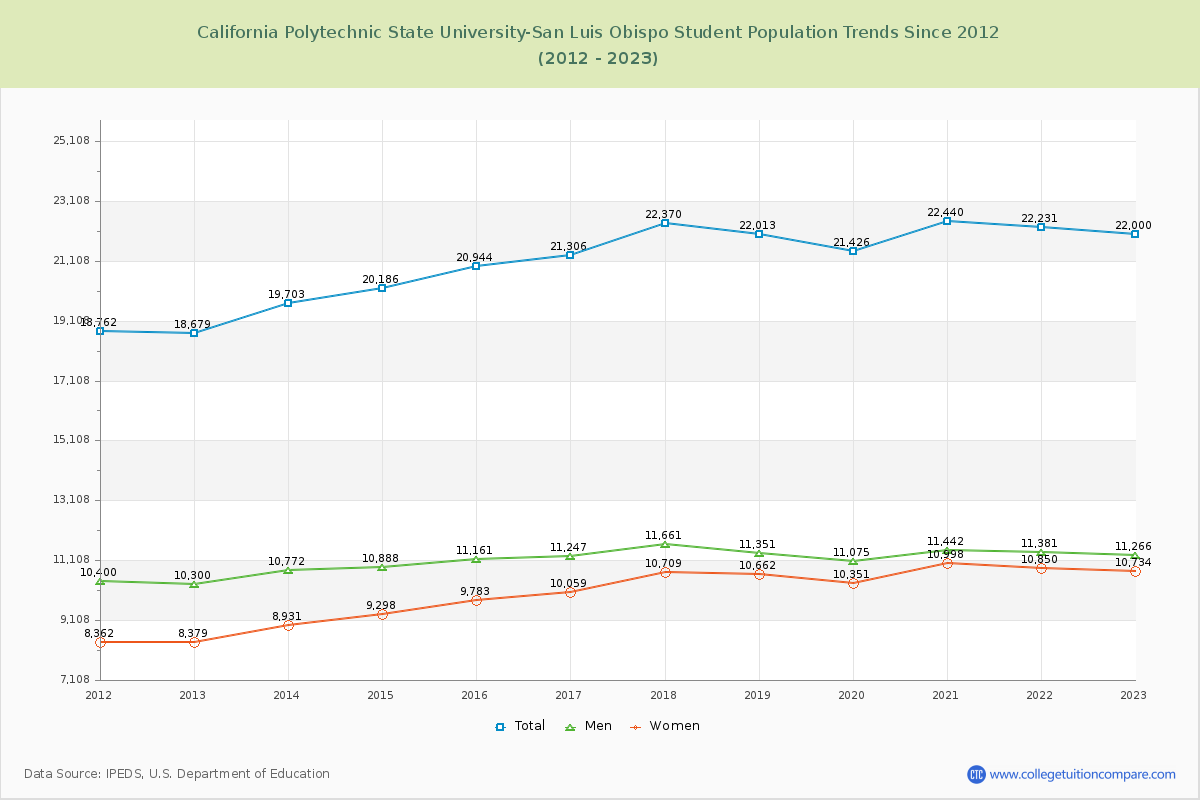
Student Population Changes
The average student population over the last 12 years is 21,209 where 22,000 students are attending the school for the academic year 2022-2023.
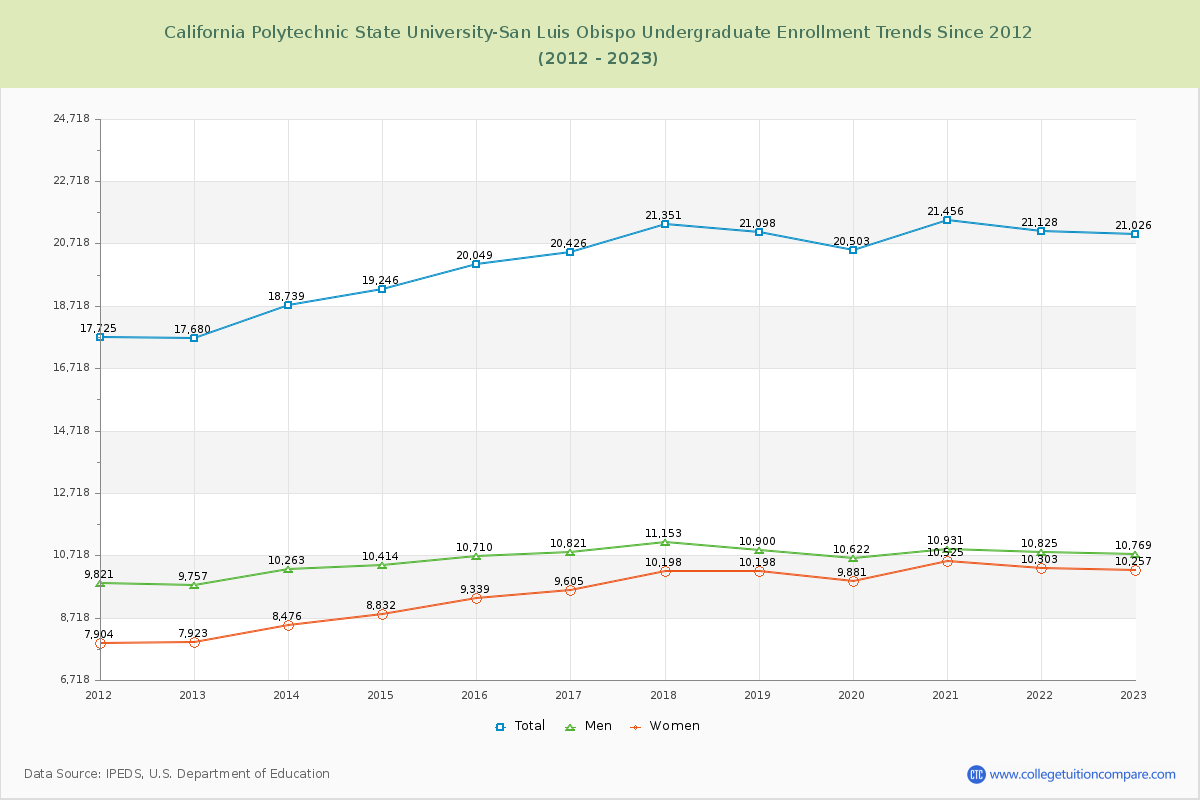
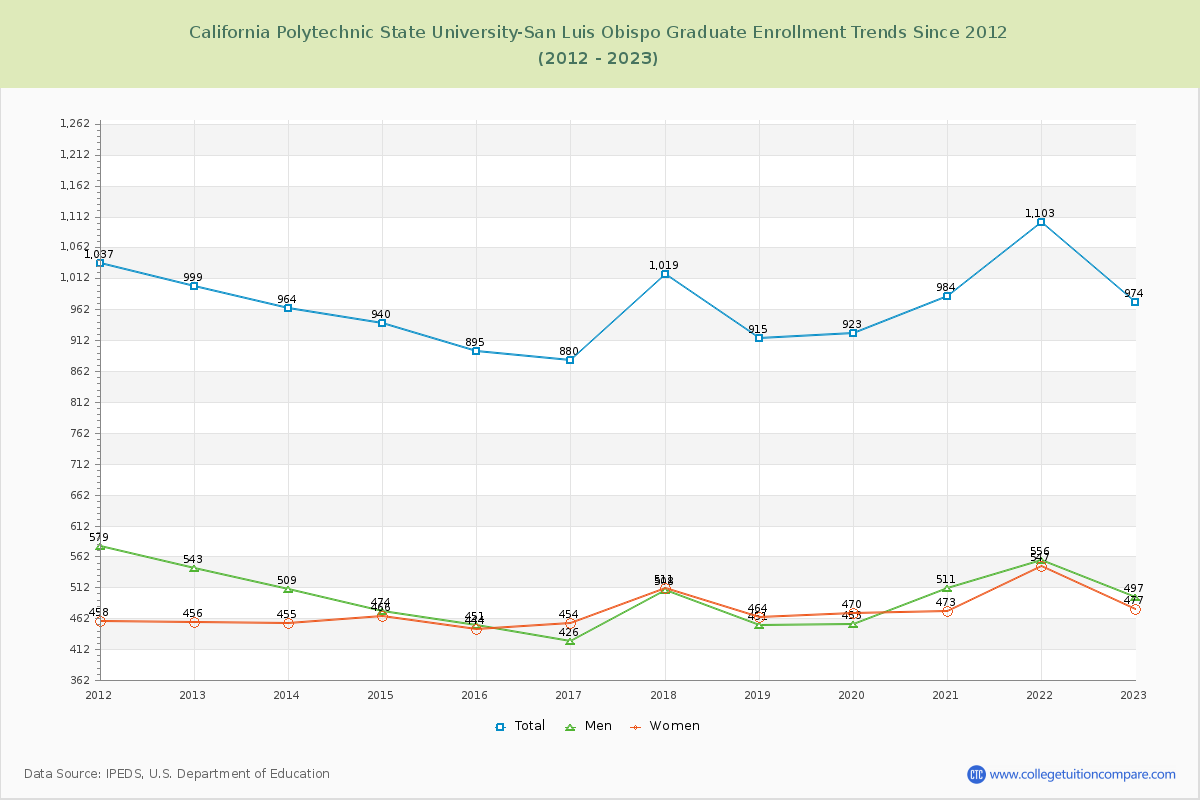
95.57% of total students is undergraduate students and 4.43% students is graduate students. The number of undergraduate students has increased by 3,346 and the graduate enrollment has decreased by 25 over past 10 years.
The female to male ratio is 0.95 to 1 and it means that there are similar numbers of female and male students enrolled in Cal Poly.
The following table and chart illustrate the changes in student population by gender at California Polytechnic State University-San Luis Obispo since 2012.
| Year | Total | Undergraduate | Graduate | ||||
|---|---|---|---|---|---|---|---|
| Total | Men | Women | Total | Men | Women | ||
| 2012-13 | 18,679 | 17,680 | 9,757 | 7,923 | 999 | 543 | 456 |
| 2013-14 | 19,703 1,024 | 18,739 1,059 | 10,263 506 | 8,476 553 | 964 -35 | 509 -34 | 455 -1 |
| 2014-15 | 20,186 483 | 19,246 507 | 10,414 151 | 8,832 356 | 940 -24 | 474 -35 | 466 11 |
| 2015-16 | 20,944 758 | 20,049 803 | 10,710 296 | 9,339 507 | 895 -45 | 451 -23 | 444 -22 |
| 2016-17 | 21,306 362 | 20,426 377 | 10,821 111 | 9,605 266 | 880 -15 | 426 -25 | 454 10 |
| 2017-18 | 22,370 1,064 | 21,351 925 | 11,153 332 | 10,198 593 | 1,019 139 | 508 82 | 511 57 |
| 2018-19 | 22,013 -357 | 21,098 -253 | 10,900 -253 | 10,198 0 | 915 -104 | 451 -57 | 464 -47 |
| 2019-20 | 21,426 -587 | 20,503 -595 | 10,622 -278 | 9,881 -317 | 923 8 | 453 2 | 470 6 |
| 2020-21 | 22,440 1,014 | 21,456 953 | 10,931 309 | 10,525 644 | 984 61 | 511 58 | 473 3 |
| 2021-22 | 22,231 -209 | 21,128 -328 | 10,825 -106 | 10,303 -222 | 1,103 119 | 556 45 | 547 74 |
| 2022-23 | 22,000 -231 | 21,026 -102 | 10,769 -56 | 10,257 -46 | 974 -129 | 497 -59 | 477 -70 |
| Average | 21,209 | 20,246 | 10,651 | 9,594 | 963 | 489 | 474 |