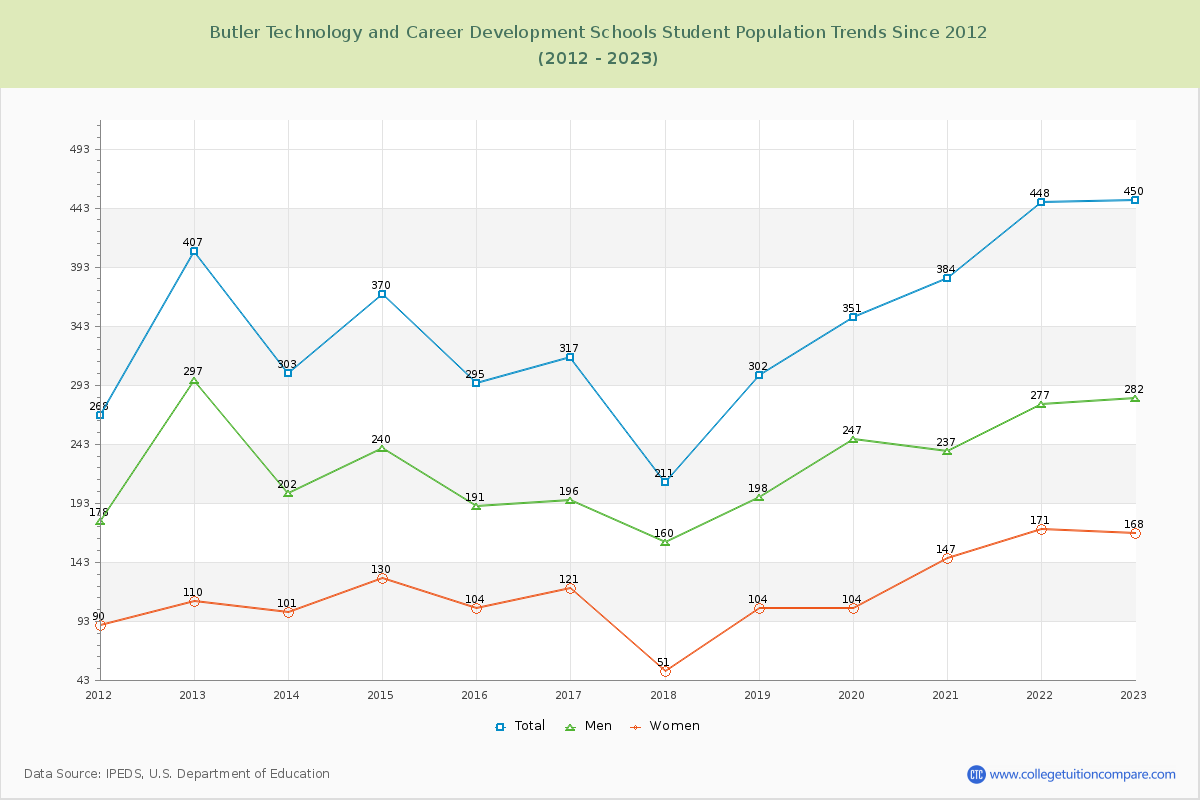
Student Population Changes
The average student population over the last 12 years is 349 where 450 students are attending the school for the academic year 2022-2023.
The female to male ratio is 0.60 to 1 and it means that there are more male students enrolled in Butler Technology and Career Development Schools than female students.
The following table and chart illustrate the changes in student population by gender at Butler Technology and Career Development Schools since 2012.
| Year | Total | Men | Women |
|---|---|---|---|
| 2012-13 | 407 | 297 | 110 |
| 2013-14 | 303 -104 | 202 -95 | 101 -9 |
| 2014-15 | 370 67 | 240 38 | 130 29 |
| 2015-16 | 295 -75 | 191 -49 | 104 -26 |
| 2016-17 | 317 22 | 196 5 | 121 17 |
| 2017-18 | 211 -106 | 160 -36 | 51 -70 |
| 2018-19 | 302 91 | 198 38 | 104 53 |
| 2019-20 | 351 49 | 247 49 | 104 0 |
| 2020-21 | 384 33 | 237 -10 | 147 43 |
| 2021-22 | 448 64 | 277 40 | 171 24 |
| 2022-23 | 450 2 | 282 5 | 168 -3 |
| Average | 349 | 230 | 119 |