Graduation Rate Changes

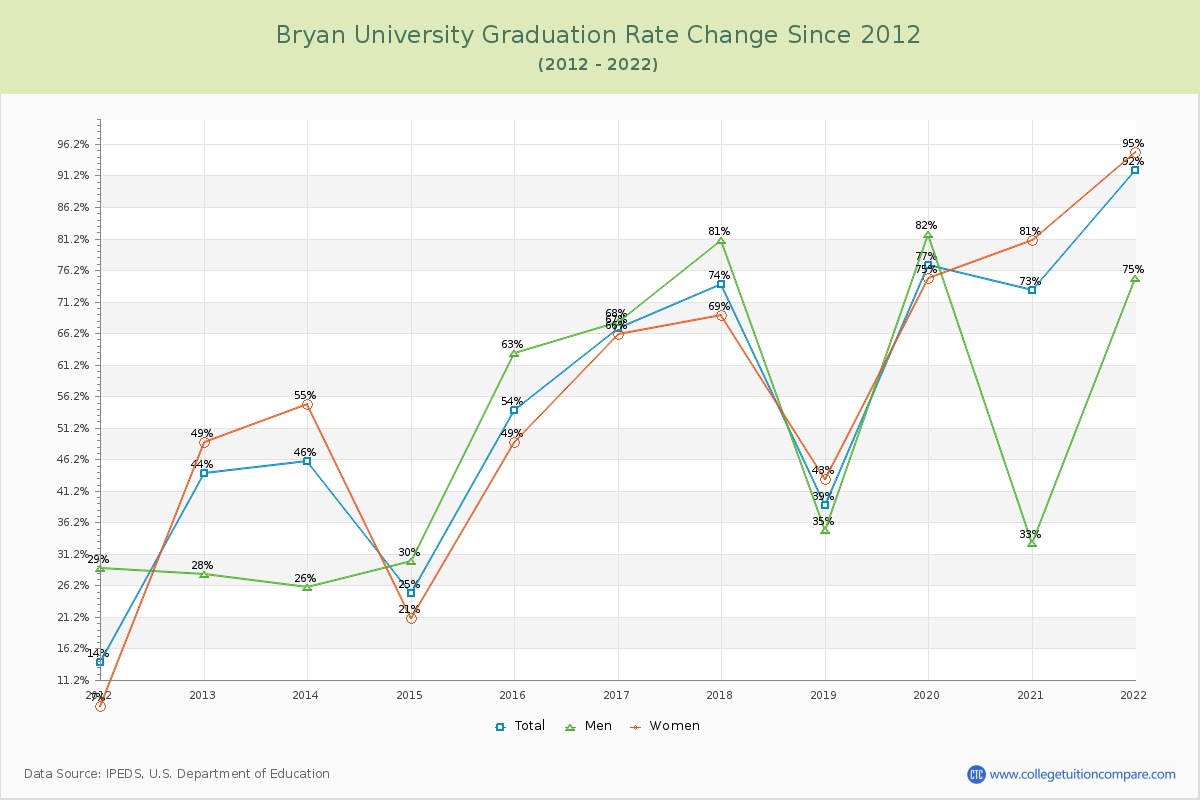
The average graduation rate of the last 11 years is 59.10% where the current academic year rate is 92%.
The following table and chart show the changes of graduation rate at Bryan University over the past 11 years (2012-2022).
TableInteractive ChartDownloadable Chart
YearTotalMenWomen
2012-13 44%28%49%
2013-14 46%26%55%
2014-15 25%30%21%
2015-16 54%63%49%
2016-17 67%68%66%
2017-18 74%81%69%
2018-19 39%35%43%
2019-20 77%82%75%
2020-21 73%33%81%
2021-22 92%75%95%
Average59.10%52.10%60.30%
Graduation Rate Changes of Bryan University
Bryan University Graduation Rate Changes Chart

Retention Rate Changes

The average retention rate of the last 11 years is 68.00% (all full-time students).
The following table shows the changes of retention rate at Bryan from 2012 to 2022.
TableChart
YearFull-timePart-time
2012-1337%-
2013-1433%-
2014-1567%-
2015-1662%-
2016-1780%-
2017-1866%-
2018-1967%-
2019-2078%-
2020-2190%-
2021-22100%-
Average68.00%-
Retention Rate Changes of Bryan University

Student to Faculty Ratio Changes

The average student to faculty ratio over the last 11 years is 15.40 to 1 where the current academic year ratio is 3 to 1. The following table and chart illustrate the change of student to faculty ratio at Bryan University since 2022.
TableChart
YearStudent to Faculty Ratio
2012-1324:1
2013-1425:1
2014-1537:1
2015-1626:1
2016-1717:1
2017-189:1
2018-196:1
2019-204:1
2020-213:1
2021-223:1
Average15.40:1
Student to Faculty Ratio Changes of Bryan University
Related Articles and Ads