Graduation Rate Changes

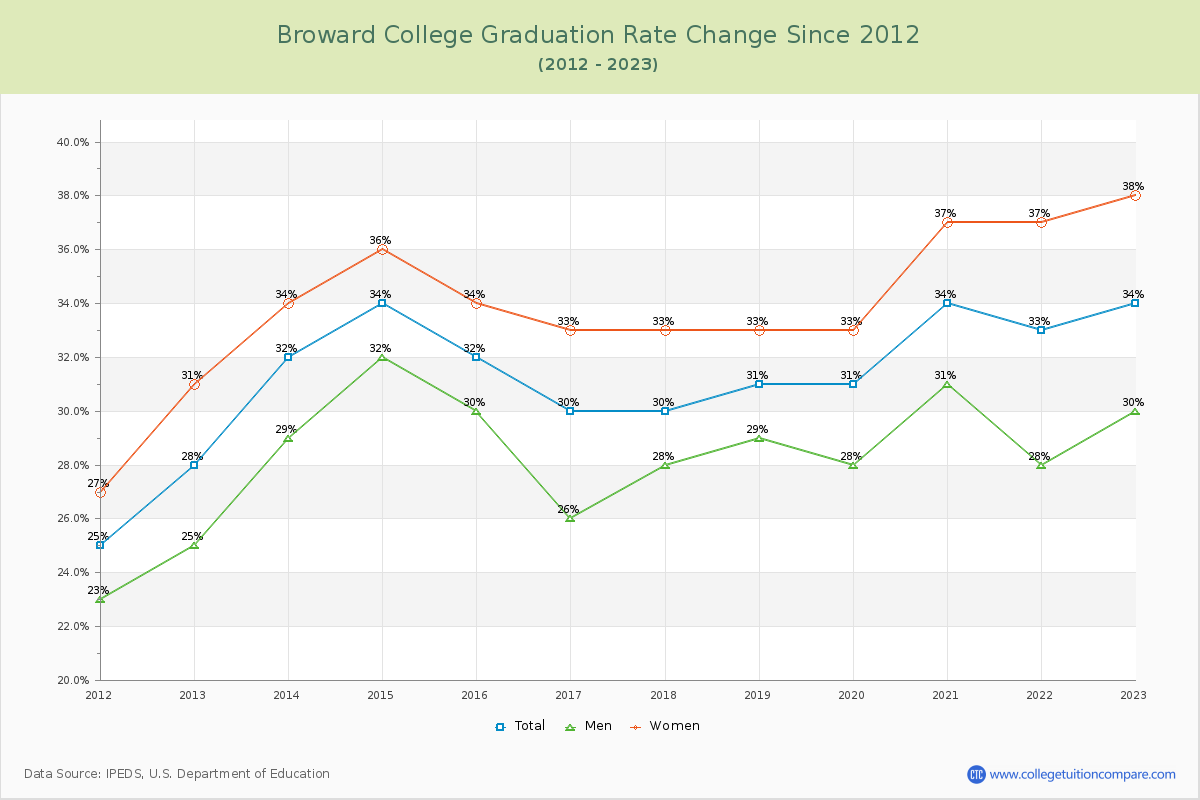
The average graduation rate of the last 12 years is 31.73% where the current academic year rate is 34%.
The following table and chart show the changes of graduation rate at Broward College over the past 12 years (2012-2023).
TableInteractive ChartDownloadable Chart
YearTotalMenWomen
2012-13 28%25%31%
2013-14 32%29%34%
2014-15 34%32%36%
2015-16 32%30%34%
2016-17 30%26%33%
2017-18 30%28%33%
2018-19 31%29%33%
2019-20 31%28%33%
2020-21 34%31%37%
2021-22 33%28%37%
2022-23 34%30%38%
Average31.73%28.73%34.45%
Graduation Rate Changes of Broward College
Broward College Graduation Rate Changes Chart

Transfer-out Rate Changes

The average transfer-out rate of the last 12 years is 13.00% where the current year rate is 11%. The following table and chart illustrate the change of transfer-out rate at Broward College from 2012 to 2023.
TableChart
YearTransfer-out Rate
2012-1319%
2013-1416%
2014-1514%
2015-1615%
2016-178%
2017-1814%
2018-1912%
2019-2011%
2020-2112%
2021-2211%
2022-2311%
Average13.00%
Transfer-out Rate Changes of Broward College

Retention Rate Changes

The average retention rate of the last 12 years is 0.00% (all part-time students).
The following table shows the changes of retention rate at BC from 2012 to 2023.
TableChart
YearFull-timePart-time
2012-13--
2013-14--
2014-15--
2015-16--
2016-17--
2017-18--
2018-19--
2019-20--
2020-21--
2021-22--
2022-23--
Retention Rate Changes of Broward College

Student to Faculty Ratio Changes

The average student to faculty ratio over the last 12 years is 27.73 to 1 where the current academic year ratio is 29 to 1. The following table and chart illustrate the change of student to faculty ratio at Broward College since 2023.
TableChart
YearStudent to Faculty Ratio
2012-1327:1
2013-1424:1
2014-1527:1
2015-1629:1
2016-1727:1
2017-1827:1
2018-1930:1
2019-2031:1
2020-2126:1
2021-2228:1
2022-2329:1
Average27.73:1
Student to Faculty Ratio Changes of Broward College
Related Articles and Ads