Enrollment Trends at BYU Idaho

1,782

Total Enrollment

2,179

Men

-397

Women

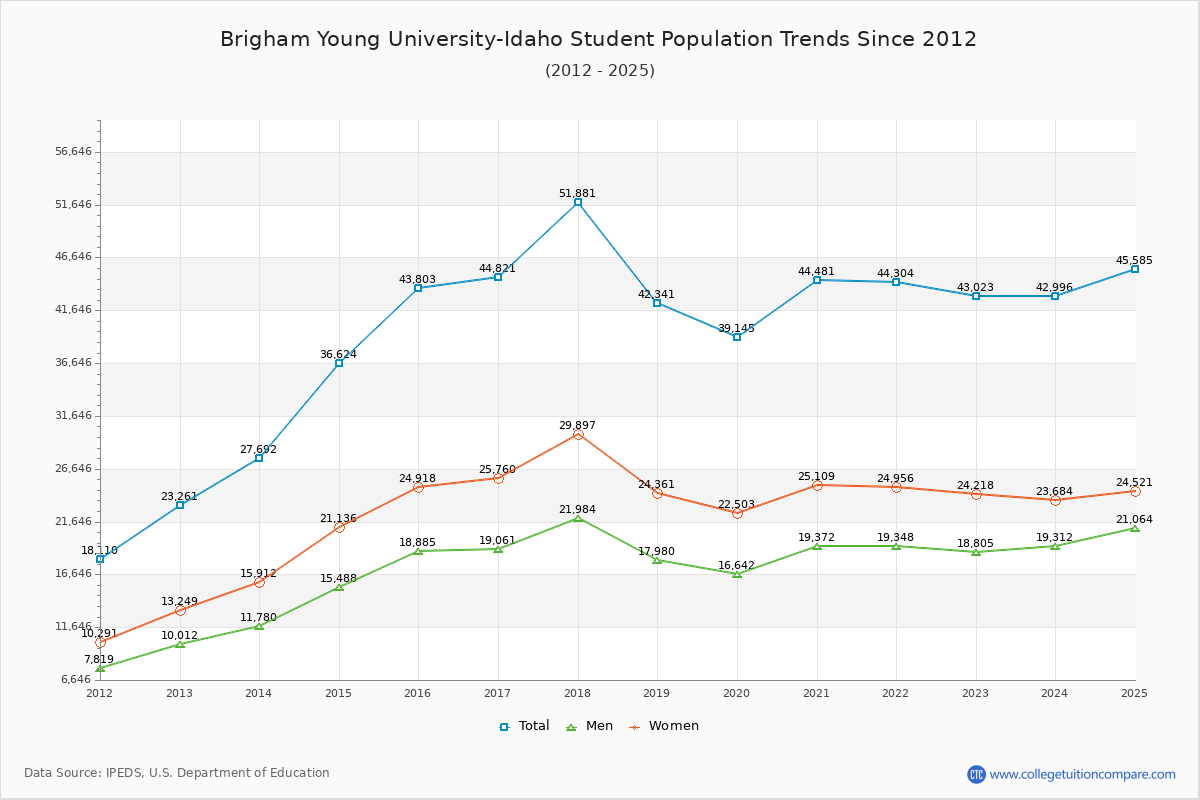
The student population at Brigham Young University-Idaho is 45,585 (all undergraduate). The number of students has increased by 1,782 over the past decade.

The female to male ratio is 1.16 to 1 which means that female students enrolled slightly more than male students.

25,139 students enrolled in online degree program exclusively and the number of online students has decreased by -0.84% since 2015.

Student Population Changes

The average student population over the last 11 years is 44,238 where 45,585 students are attending the school for the academic year 2024-2025.

The female to male ratio is 1.16 to 1 and it means that there are slightly more female students enrolled in BYU Idaho than male students.

The following table and chart illustrate the changes in student population by gender at Brigham Young University-Idaho since 2015.

YearTotalMenWomen
2015-1643,80318,88524,918
2016-1744,821
1,018
19,061
176
25,760
842
2017-1851,881
7,060
21,984
2,923
29,897
4,137
2018-1942,341
-9,540
17,980
-4,004
24,361
-5,536
2019-2039,145
-3,196
16,642
-1,338
22,503
-1,858
2020-2144,481
5,336
19,372
2,730
25,109
2,606
2021-2244,304
-177
19,348
-24
24,956
-153
2022-2343,023
-1,281
18,805
-543
24,218
-738
2023-2442,996
-27
19,312
507
23,684
-534
2024-2545,585
2,589
21,064
1,752
24,521
837
Average44,23819,24524,993
Brigham Young University-Idaho Enrollment Trends Chart

Enrollment by Race/Ethnicity Changes

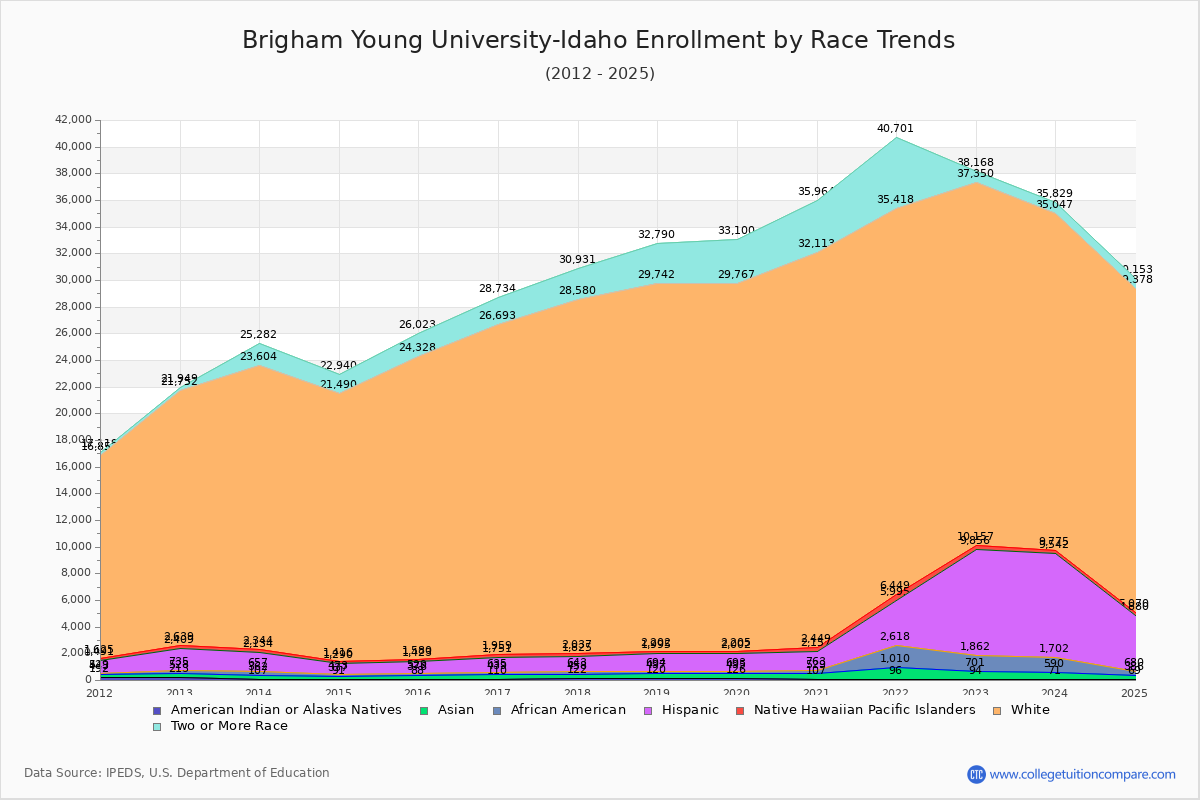
The percentage of white students is 53.32%. The percentage was 51.93% 10 years ago and BYU Idaho still has a high percentage of white students. 0.70% of enrolled students is Asian and 0.64% is black students. Hispanic students comprise 9.21% of the student body.

Over the past 10 years, the racial composition has shifted. The percentage of white students increased from 51.93% to 53.32%. Asian enrollment grew from 0.66% to 0.70%. Black student enrollment increased from 0.35% to 0.64%. Hispanic student representation expanded from 2.04% to 9.21%.

The overall racial diversity, measured by the Census Bureau Diversity Index, is 0.7068 which indicates that quite diverse. This decreased from 0.7283 a decade ago, suggesting that racial diversity has declined.

The following table and chart illustrate the student population trends by race/ethnicity at Brigham Young University-Idaho over the past 11 years (2015-2025).

YearAmerican Indian or Native AmericanAsianBlackHispanicNative Hawaiian or Other Pacific IslanderWhiteTwo or More Races
2015-168828815389415722,7481,695
2016-171103291961,11620824,7342,041
2017-181223361851,18221226,5432,351
2018-191203771971,30120727,5403,048
2019-201263691981,30920327,5623,333
2020-211074222341,39429229,6643,851
2021-22969141,6083,37745428,9695,283
2022-23946071,1617,99430127,193818
2023-24715191,1127,84023325,272782
2024-25693172944,20019024,308775
Average1004485343,06124626,4532,398
Brigham Young University-Idaho Enrollment by Race Trends Chart

Distance Learning (Online Courses) Enrollment Changes

25,139 students are enrolled in online degree programs exclusively for the academic year 2024-2025, which is 55% of total students. The number of online students has decreased -0.84% since 2015. The following table and chart illustrate the changes in the online student population by enrolled type at Brigham Young University-Idaho from 2015 to 2025.

YearTotal EnrollmentOnline CompletelyEnrolled in Some Online CoursesNot Enrolled in Online Courses
2015-1643,80325,3528,19910,252
2016-1744,82125,82010,0068,995
2017-1851,88131,55410,5039,824
2018-1942,34121,05311,3959,893
2019-2039,14517,44810,09211,605
2020-2144,48122,21814,3057,958
2021-2244,30423,05811,6599,587
2022-2343,02322,54111,4998,983
2023-2442,99623,15311,5098,334
2024-2545,58525,13914,3236,123
Average44,23823,73411,3499,155

Ratings & Review

Share your experiences and thoughts about Brigham Young University-Idaho. It will be a great help to applicants and prospective students!