Student Population Changes
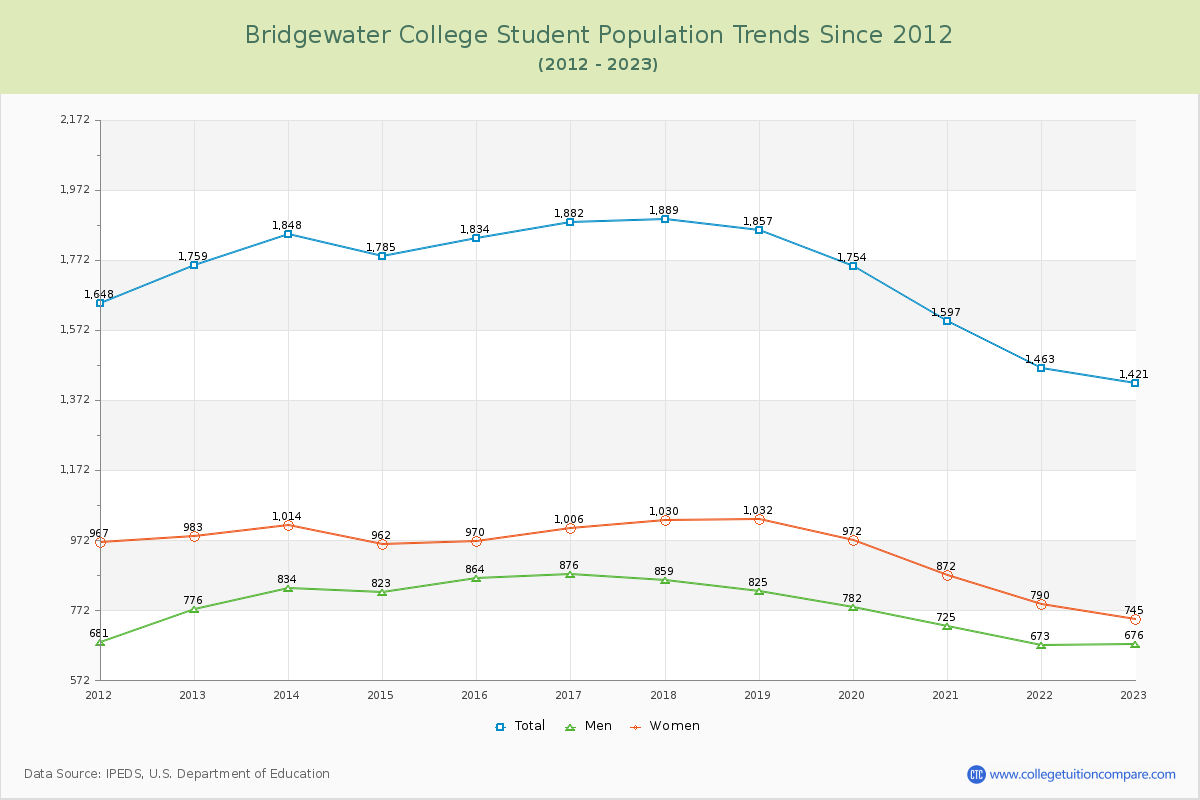
The average student population over the last 12 years is 1,735 where 1,421 students are attending the school for the academic year 2022-2023.
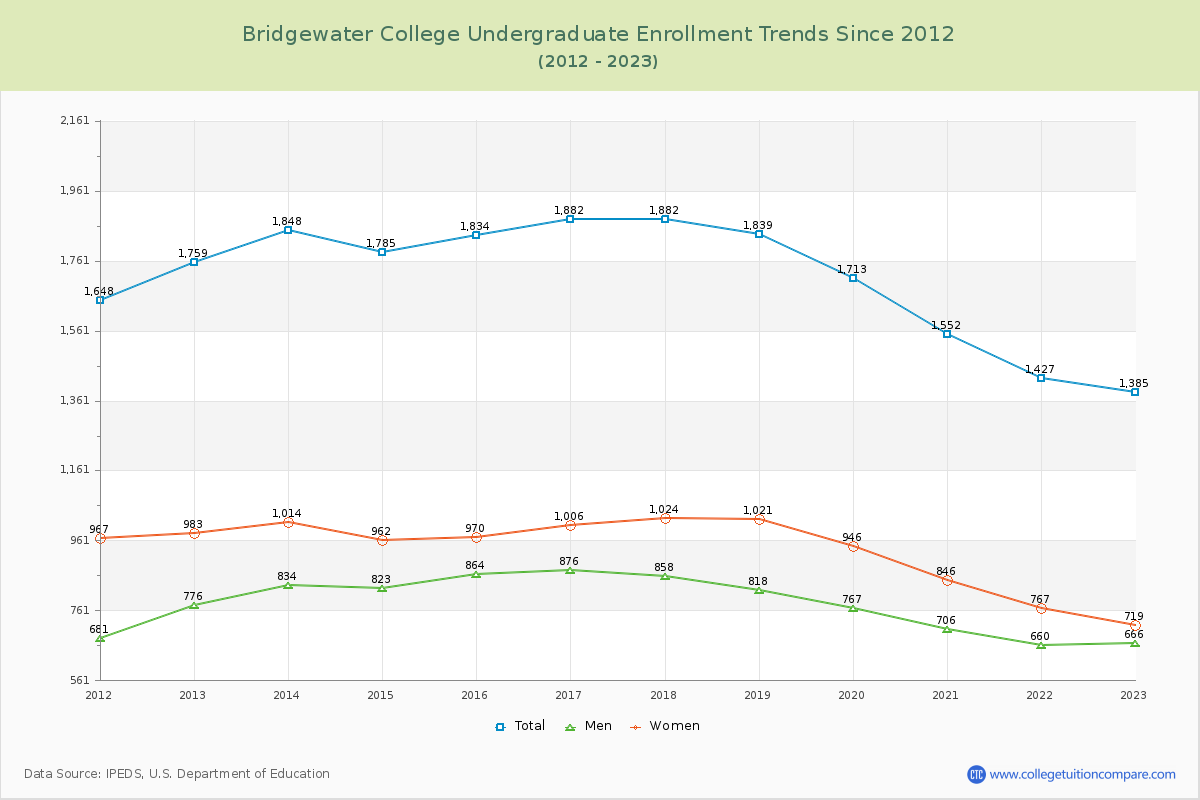
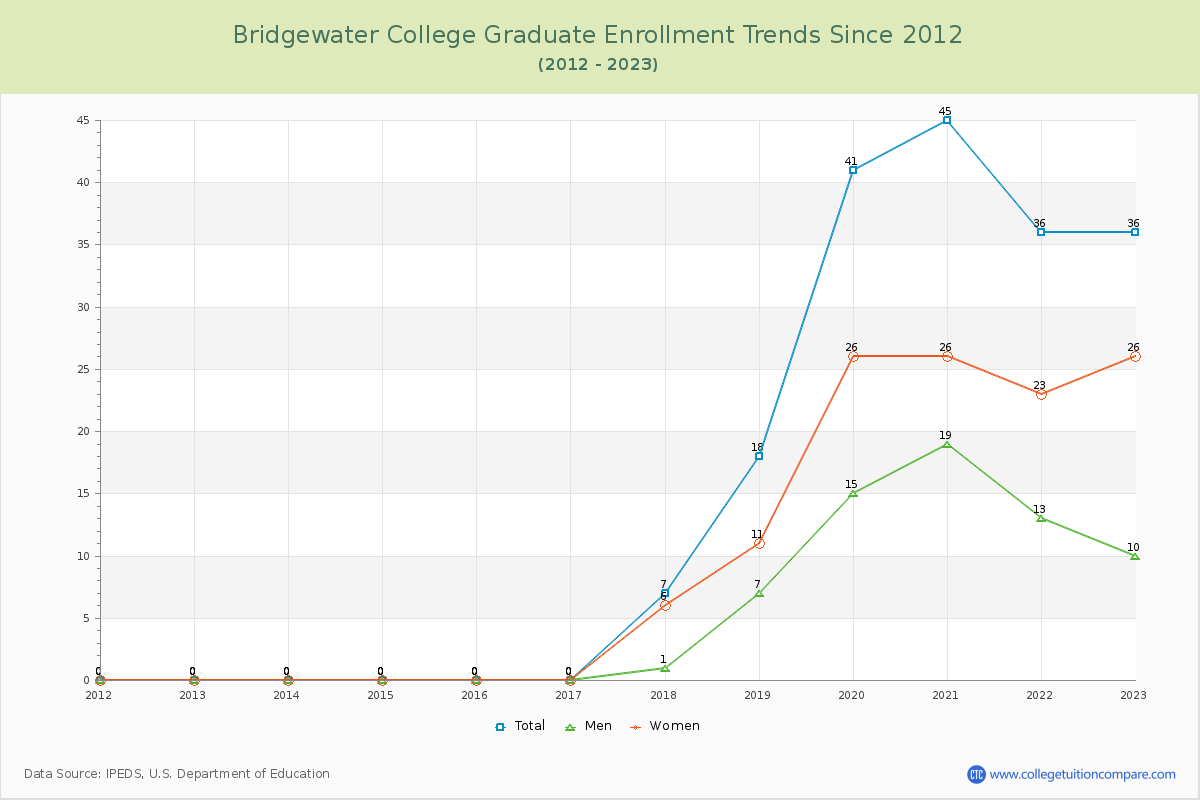
97.47% of total students is undergraduate students and 2.53% students is graduate students. The number of undergraduate students has decreased by 374 and the graduate enrollment has increased by 36 over past 10 years.
The female to male ratio is 1.10 to 1 and it means that there are similar numbers of female and male students enrolled in BC.
The following table and chart illustrate the changes in student population by gender at Bridgewater College since 2012.
| Year | Total | Undergraduate | Graduate | ||||
|---|---|---|---|---|---|---|---|
| Total | Men | Women | Total | Men | Women | ||
| 2012-13 | 1,759 | 1,759 | 776 | 983 | 0 | 0 | 0 |
| 2013-14 | 1,848 89 | 1,848 89 | 834 58 | 1,014 31 | 0 0 | 0 0 | 0 0 |
| 2014-15 | 1,785 -63 | 1,785 -63 | 823 -11 | 962 -52 | 0 0 | 0 0 | 0 0 |
| 2015-16 | 1,834 49 | 1,834 49 | 864 41 | 970 8 | 0 0 | 0 0 | 0 0 |
| 2016-17 | 1,882 48 | 1,882 48 | 876 12 | 1,006 36 | 0 0 | 0 0 | 0 0 |
| 2017-18 | 1,889 7 | 1,882 0 | 858 -18 | 1,024 18 | 7 7 | 1 1 | 6 6 |
| 2018-19 | 1,857 -32 | 1,839 -43 | 818 -40 | 1,021 -3 | 18 11 | 7 6 | 11 5 |
| 2019-20 | 1,754 -103 | 1,713 -126 | 767 -51 | 946 -75 | 41 23 | 15 8 | 26 15 |
| 2020-21 | 1,597 -157 | 1,552 -161 | 706 -61 | 846 -100 | 45 4 | 19 4 | 26 0 |
| 2021-22 | 1,463 -134 | 1,427 -125 | 660 -46 | 767 -79 | 36 -9 | 13 -6 | 23 -3 |
| 2022-23 | 1,421 -42 | 1,385 -42 | 666 6 | 719 -48 | 36 0 | 10 -3 | 26 3 |
| Average | 1,735 | 1,719 | 786 | 933 | 17 | 6 | 11 |