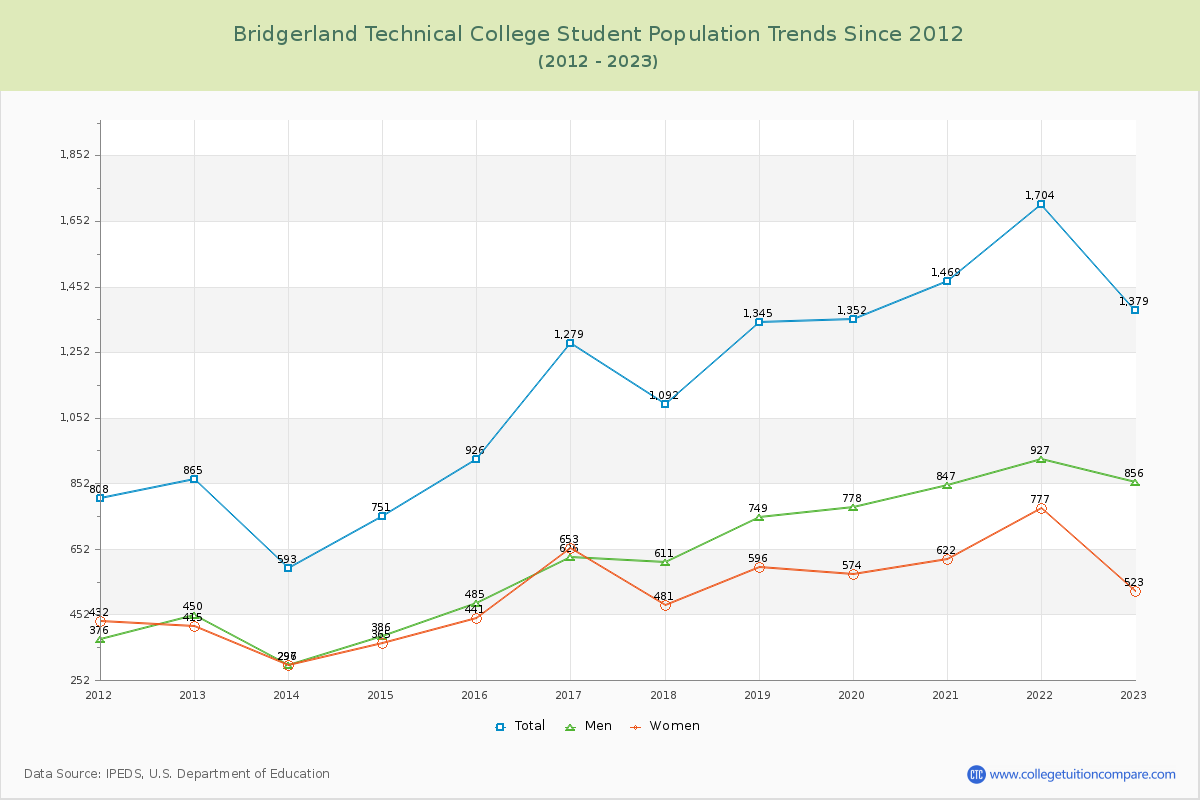
Student Population Changes
The average student population over the last 12 years is 1,160 where 1,379 students are attending the school for the academic year 2022-2023.
The female to male ratio is 0.61 to 1 and it means that there are more male students enrolled in BATC than female students.
The following table and chart illustrate the changes in student population by gender at Bridgerland Technical College since 2012.
| Year | Total | Men | Women |
|---|---|---|---|
| 2012-13 | 865 | 450 | 415 |
| 2013-14 | 593 -272 | 296 -154 | 297 -118 |
| 2014-15 | 751 158 | 386 90 | 365 68 |
| 2015-16 | 926 175 | 485 99 | 441 76 |
| 2016-17 | 1,279 353 | 626 141 | 653 212 |
| 2017-18 | 1,092 -187 | 611 -15 | 481 -172 |
| 2018-19 | 1,345 253 | 749 138 | 596 115 |
| 2019-20 | 1,352 7 | 778 29 | 574 -22 |
| 2020-21 | 1,469 117 | 847 69 | 622 48 |
| 2021-22 | 1,704 235 | 927 80 | 777 155 |
| 2022-23 | 1,379 -325 | 856 -71 | 523 -254 |
| Average | 1,160 | 637 | 522 |