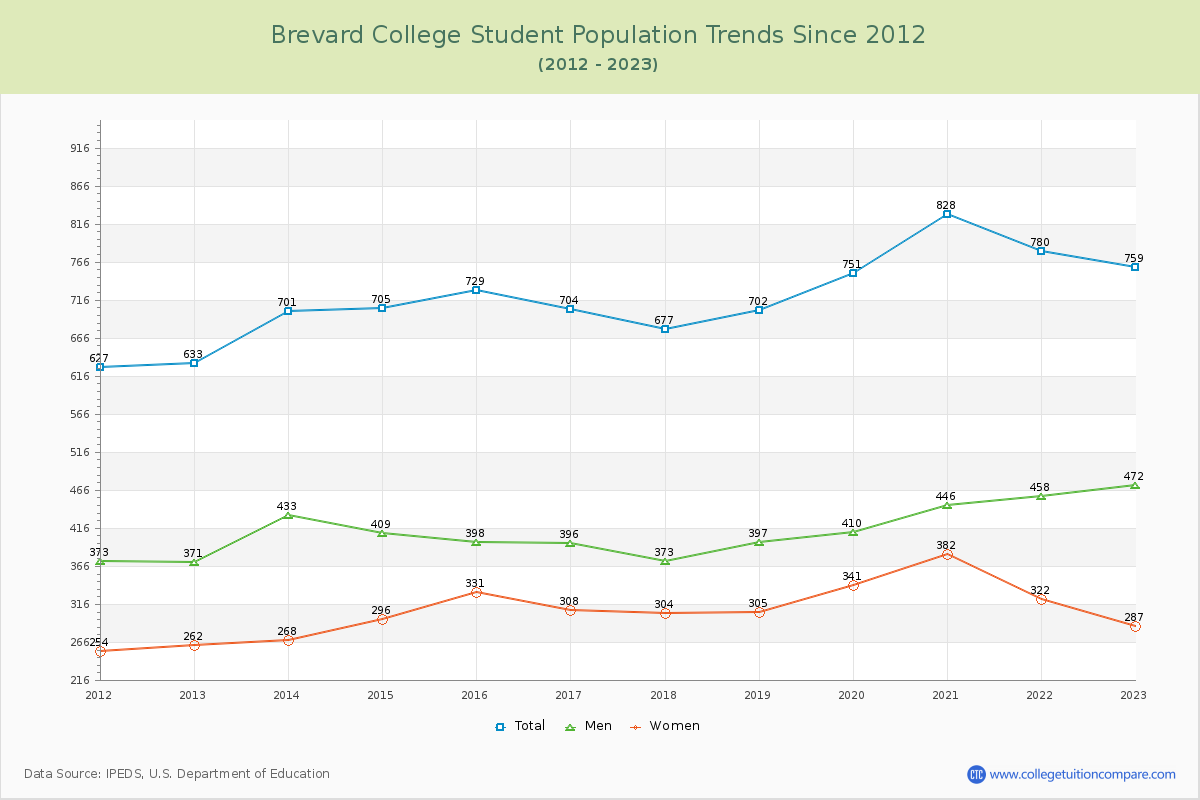
Student Population Changes
The average student population over the last 12 years is 724 where 759 students are attending the school for the academic year 2022-2023.
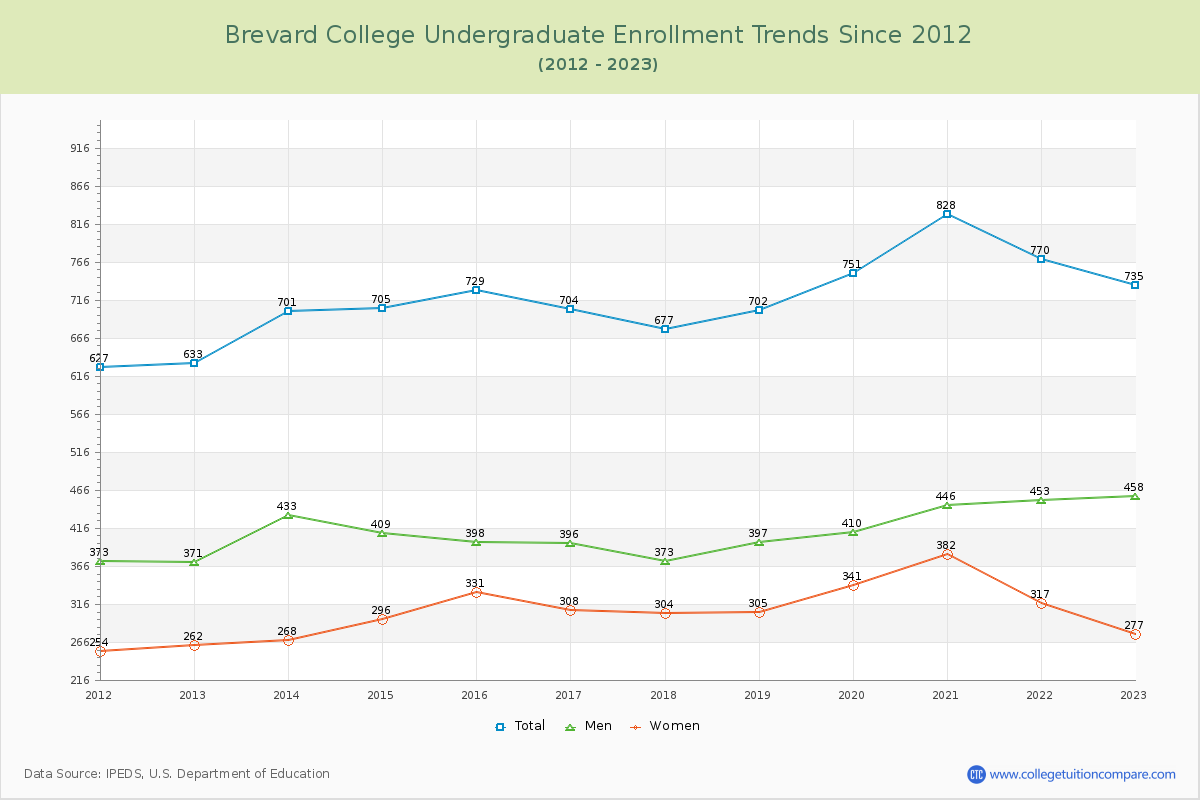
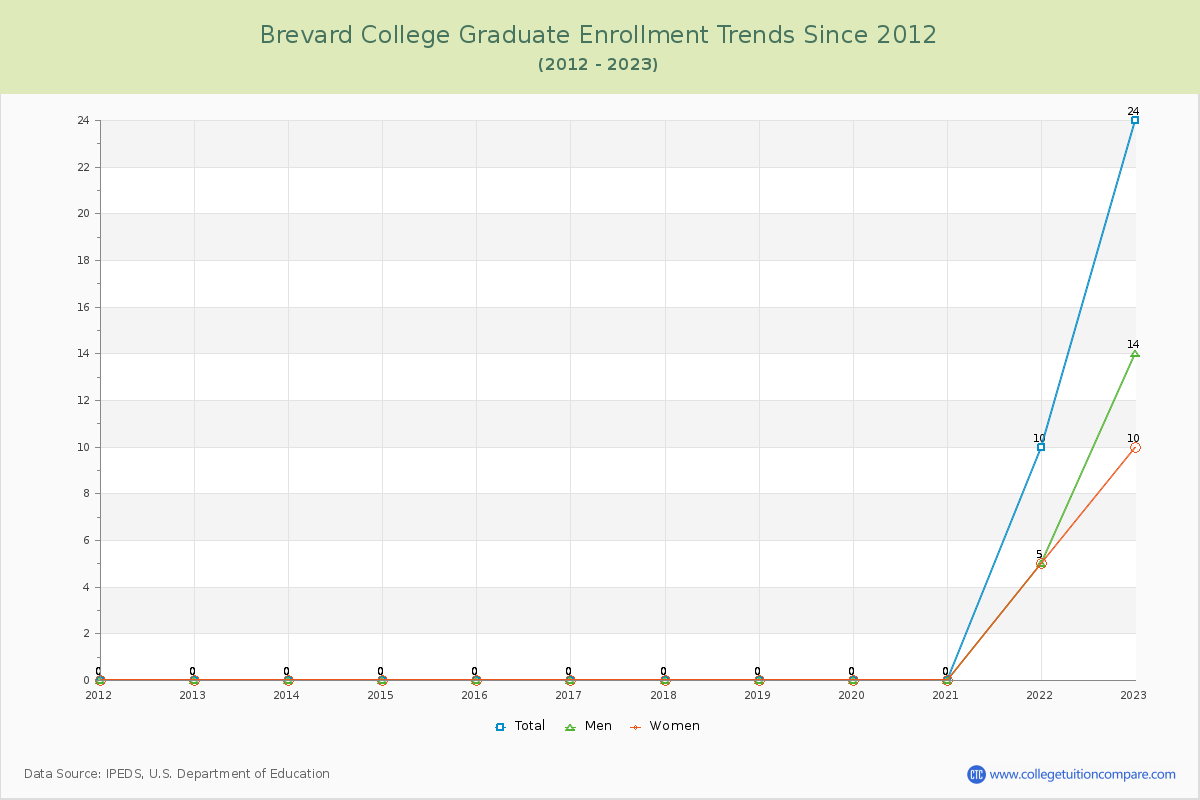
96.84% of total students is undergraduate students and 3.16% students is graduate students. The number of undergraduate students has increased by 102 and the graduate enrollment has increased by 24 over past 10 years.
The female to male ratio is 0.61 to 1 and it means that there are more male students enrolled in Brevard than female students.
The following table and chart illustrate the changes in student population by gender at Brevard College since 2012.
| Year | Total | Undergraduate | Graduate | ||||
|---|---|---|---|---|---|---|---|
| Total | Men | Women | Total | Men | Women | ||
| 2012-13 | 633 | 633 | 371 | 262 | 0 | 0 | 0 |
| 2013-14 | 701 68 | 701 68 | 433 62 | 268 6 | 0 0 | 0 0 | 0 0 |
| 2014-15 | 705 4 | 705 4 | 409 -24 | 296 28 | 0 0 | 0 0 | 0 0 |
| 2015-16 | 729 24 | 729 24 | 398 -11 | 331 35 | 0 0 | 0 0 | 0 0 |
| 2016-17 | 704 -25 | 704 -25 | 396 -2 | 308 -23 | 0 0 | 0 0 | 0 0 |
| 2017-18 | 677 -27 | 677 -27 | 373 -23 | 304 -4 | 0 0 | 0 0 | 0 0 |
| 2018-19 | 702 25 | 702 25 | 397 24 | 305 1 | 0 0 | 0 0 | 0 0 |
| 2019-20 | 751 49 | 751 49 | 410 13 | 341 36 | 0 0 | 0 0 | 0 0 |
| 2020-21 | 828 77 | 828 77 | 446 36 | 382 41 | 0 0 | 0 0 | 0 0 |
| 2021-22 | 780 -48 | 770 -58 | 453 7 | 317 -65 | 10 10 | 5 5 | 5 5 |
| 2022-23 | 759 -21 | 735 -35 | 458 5 | 277 -40 | 24 14 | 14 9 | 10 5 |
| Average | 724 | 721 | 413 | 308 | 3 | 2 | 1 |