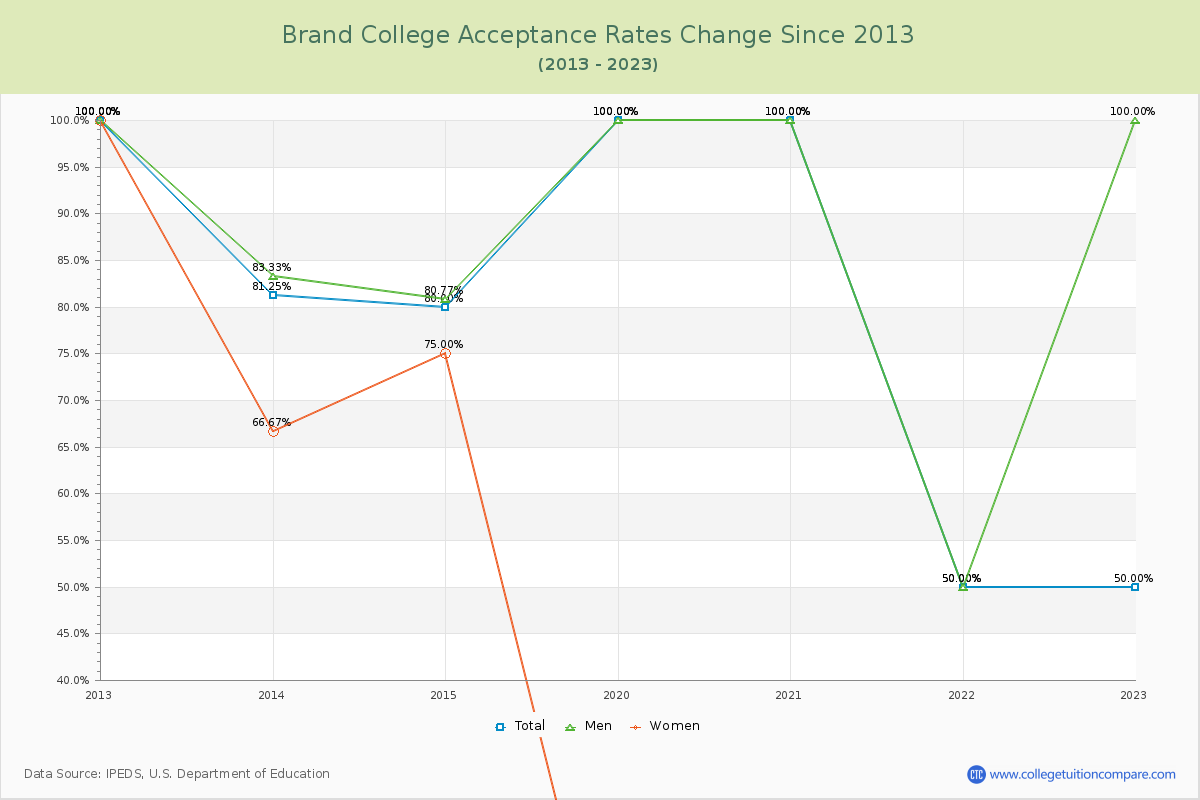
Acceptance Rate Changes
The average acceptance rate over the last 10 years is 51.02%, and this year's acceptance rate is 50.00% at Brand College. By gender, men students' acceptance rate is 55.83% and women students' rate is 21.97%.
The next table and chart illustrate the acceptance rates changes at Brand College over the past 11 years (2012-2023).
| Year | Total | Men | Women |
|---|---|---|---|
| 2012-13 | 100.00% | 100.00% | 100.00% |
| 2013-14 | 81.25% -18.75% |
83.33% -33.33% |
66.67% -33.33% |
| 2014-15 | 80.00% -1.25% |
80.77% 8.33% |
75.00% 8.33% |
| 2015-16 | - | - | - |
| 2016-17 | - | - | - |
| 2017-18 | - | - | - |
| 2018-19 | - | - | - |
| 2019-20 | 100.00% - |
100.00% - |
0.00% - |
| 2020-21 | 100.00% 0.00% |
100.00% 0.00% |
0.00% 0.00% |
| 2021-22 | 50.00% -50.00% |
50.00% 0.00% |
0.00% 0.00% |
| 2022-23 | 50.00% 0.00% |
100.00% 0.00% |
0.00% 0.00% |
| Average | 51.02% | 55.83% | 21.97% |