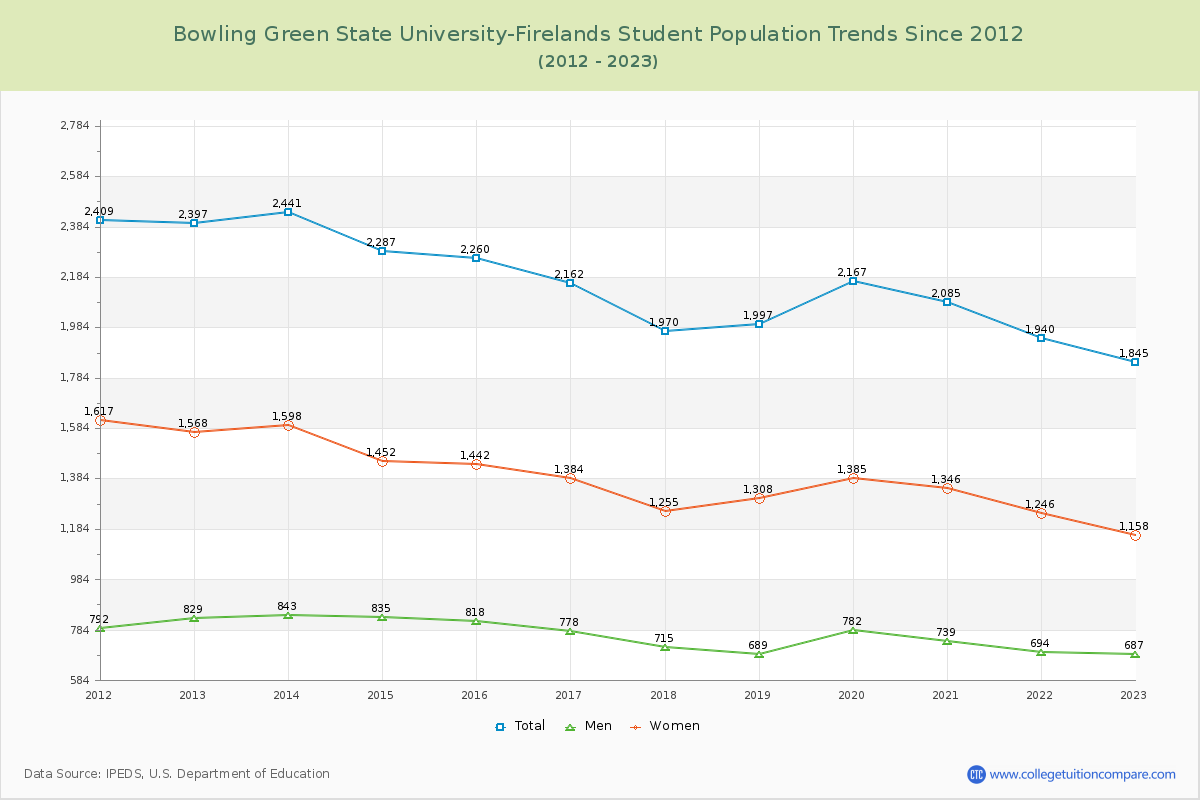
Student Population Changes
The average student population over the last 12 years is 2,141 where 1,845 students are attending the school for the academic year 2022-2023.
The female to male ratio is 1.69 to 1 and it means that there are more female students enrolled in BGSU-Firelands than male students.
The following table and chart illustrate the changes in student population by gender at Bowling Green State University-Firelands since 2012.
| Year | Total | Men | Women |
|---|---|---|---|
| 2012-13 | 2,397 | 829 | 1,568 |
| 2013-14 | 2,441 44 | 843 14 | 1,598 30 |
| 2014-15 | 2,287 -154 | 835 -8 | 1,452 -146 |
| 2015-16 | 2,260 -27 | 818 -17 | 1,442 -10 |
| 2016-17 | 2,162 -98 | 778 -40 | 1,384 -58 |
| 2017-18 | 1,970 -192 | 715 -63 | 1,255 -129 |
| 2018-19 | 1,997 27 | 689 -26 | 1,308 53 |
| 2019-20 | 2,167 170 | 782 93 | 1,385 77 |
| 2020-21 | 2,085 -82 | 739 -43 | 1,346 -39 |
| 2021-22 | 1,940 -145 | 694 -45 | 1,246 -100 |
| 2022-23 | 1,845 -95 | 687 -7 | 1,158 -88 |
| Average | 2,141 | 764 | 1,377 |