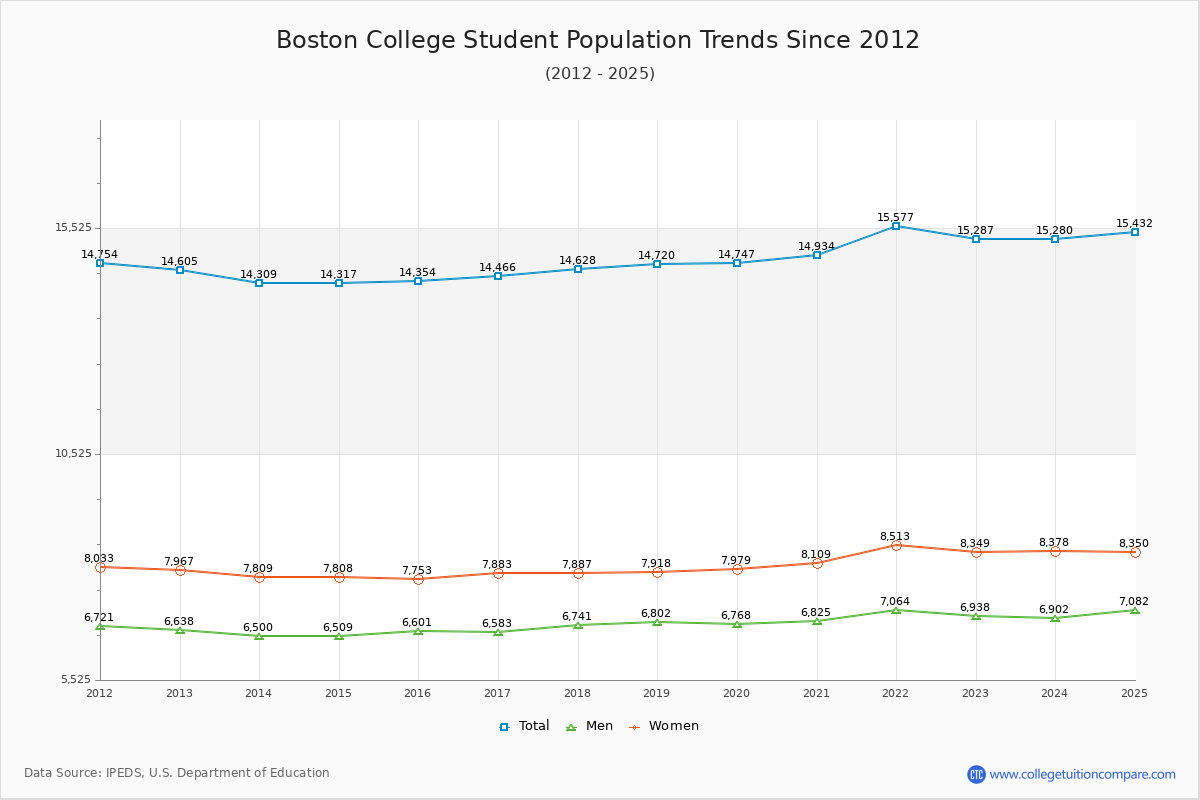
Student Population Changes
The average student population over the last 12 years is 14,722 where 15,287 students are attending the school for the academic year 2022-2023.
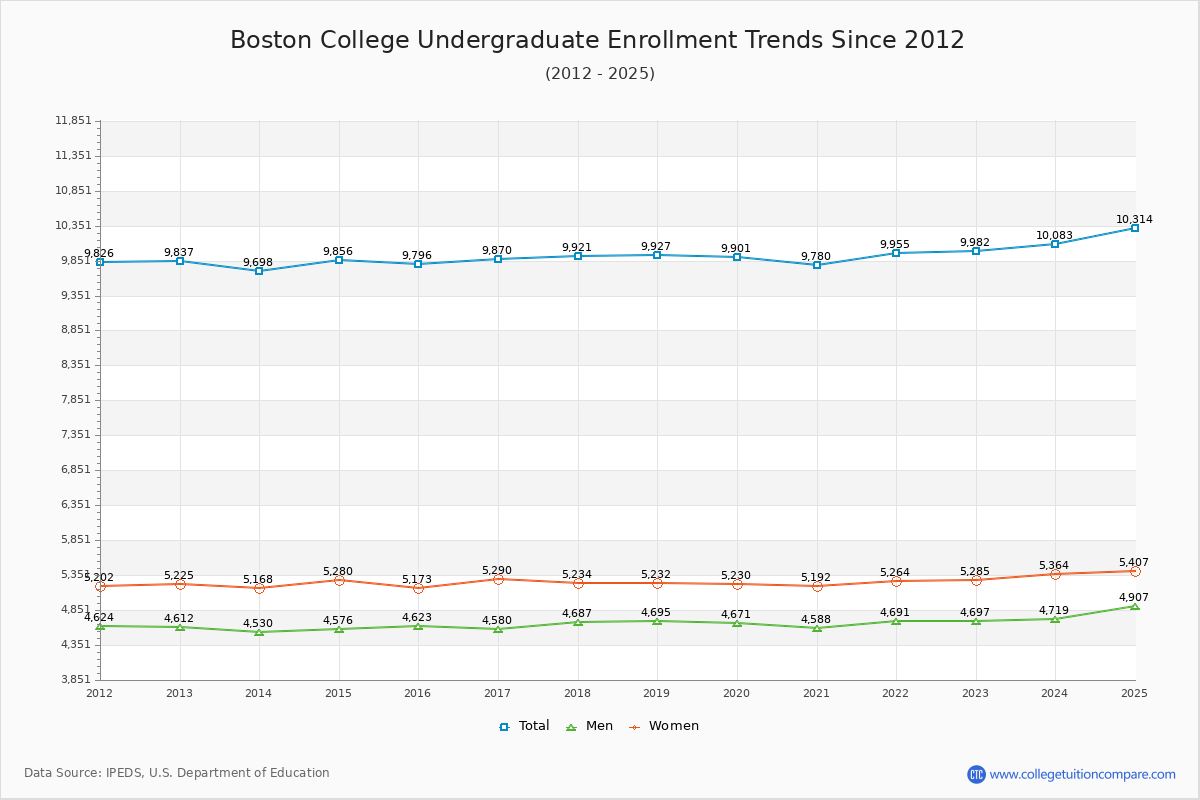
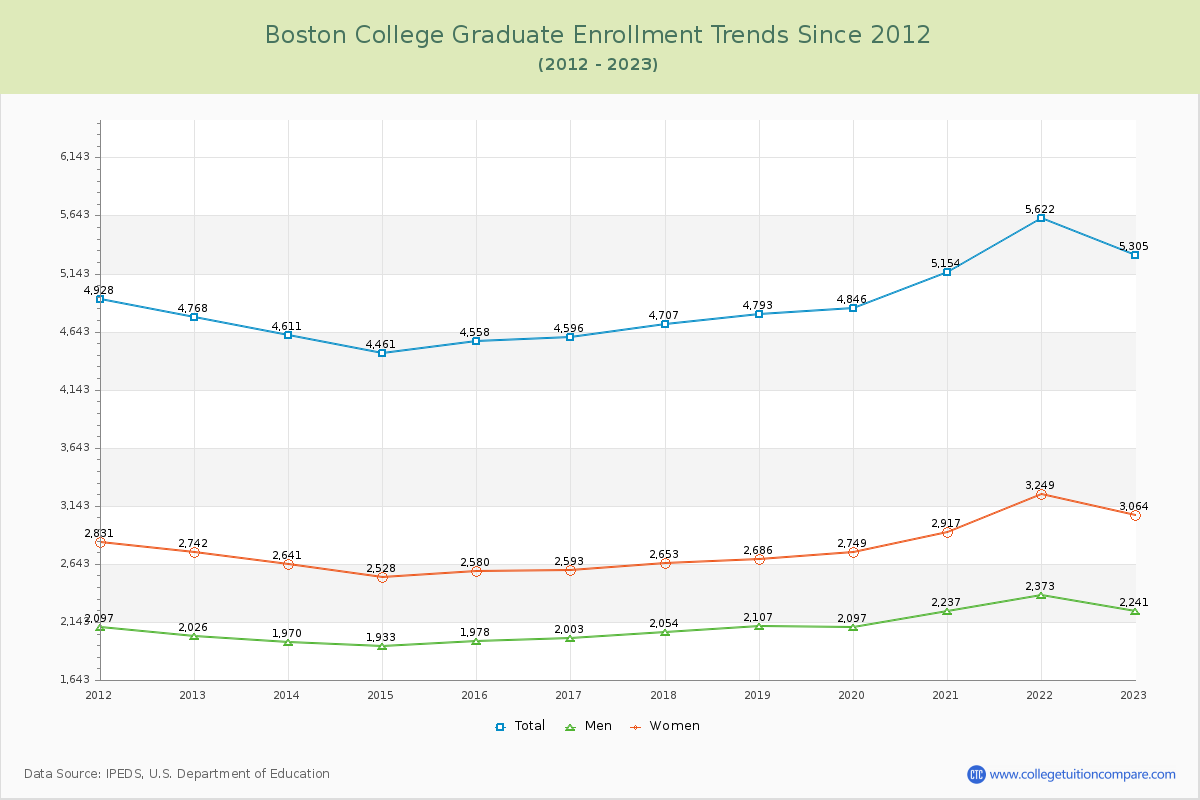
65.30% of total students is undergraduate students and 34.70% students is graduate students. The number of undergraduate students has increased by 145 and the graduate enrollment has increased by 537 over past 10 years.
The female to male ratio is 1.20 to 1 and it means that there are slightly more female students enrolled in Boston than male students.
The following table and chart illustrate the changes in student population by gender at Boston College since 2012.
| Year | Total | Undergraduate | Graduate | ||||
|---|---|---|---|---|---|---|---|
| Total | Men | Women | Total | Men | Women | ||
| 2012-13 | 14,605 | 9,837 | 4,612 | 5,225 | 4,768 | 2,026 | 2,742 |
| 2013-14 | 14,309 -296 | 9,698 -139 | 4,530 -82 | 5,168 -57 | 4,611 -157 | 1,970 -56 | 2,641 -101 |
| 2014-15 | 14,317 8 | 9,856 158 | 4,576 46 | 5,280 112 | 4,461 -150 | 1,933 -37 | 2,528 -113 |
| 2015-16 | 14,354 37 | 9,796 -60 | 4,623 47 | 5,173 -107 | 4,558 97 | 1,978 45 | 2,580 52 |
| 2016-17 | 14,466 112 | 9,870 74 | 4,580 -43 | 5,290 117 | 4,596 38 | 2,003 25 | 2,593 13 |
| 2017-18 | 14,628 162 | 9,921 51 | 4,687 107 | 5,234 -56 | 4,707 111 | 2,054 51 | 2,653 60 |
| 2018-19 | 14,720 92 | 9,927 6 | 4,695 8 | 5,232 -2 | 4,793 86 | 2,107 53 | 2,686 33 |
| 2019-20 | 14,747 27 | 9,901 -26 | 4,671 -24 | 5,230 -2 | 4,846 53 | 2,097 -10 | 2,749 63 |
| 2020-21 | 14,934 187 | 9,780 -121 | 4,588 -83 | 5,192 -38 | 5,154 308 | 2,237 140 | 2,917 168 |
| 2021-22 | 15,577 643 | 9,955 175 | 4,691 103 | 5,264 72 | 5,622 468 | 2,373 136 | 3,249 332 |
| 2022-23 | 15,287 -290 | 9,982 27 | 4,697 6 | 5,285 21 | 5,305 -317 | 2,241 -132 | 3,064 -185 |
| Average | 14,722 | 9,866 | 4,632 | 5,234 | 4,856 | 2,093 | 2,764 |