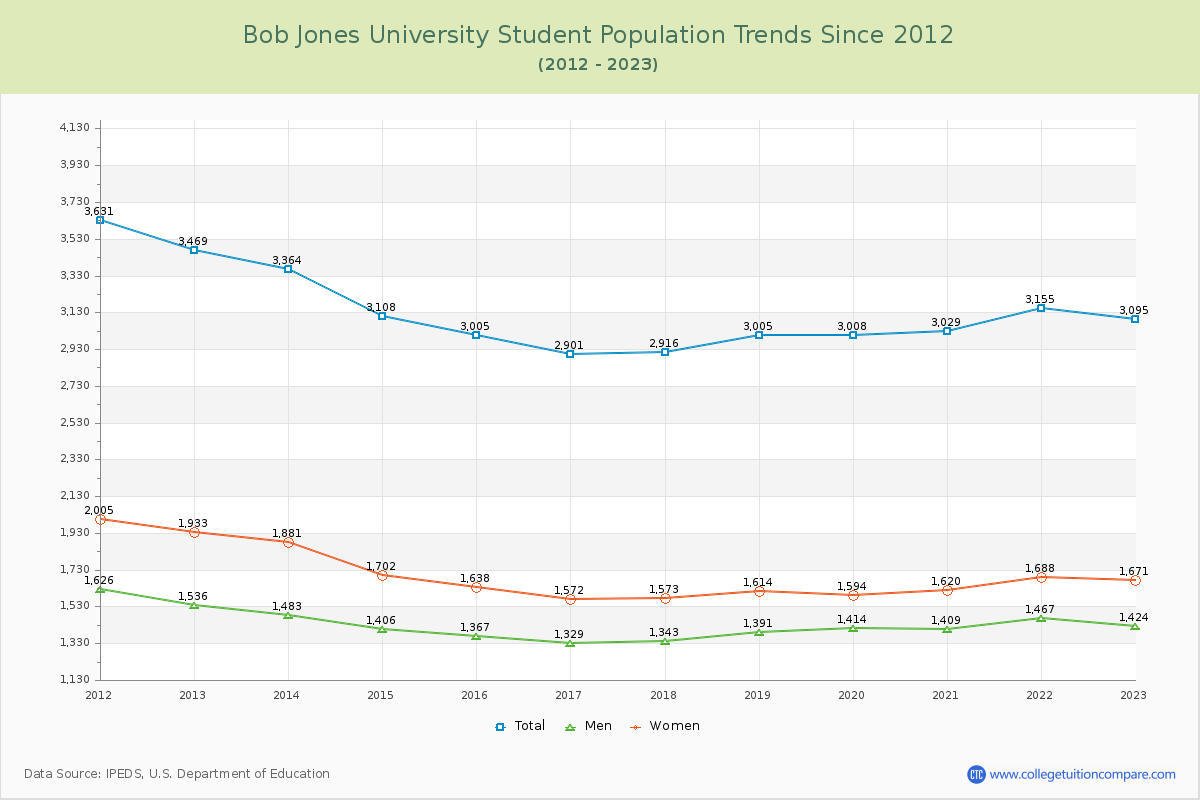
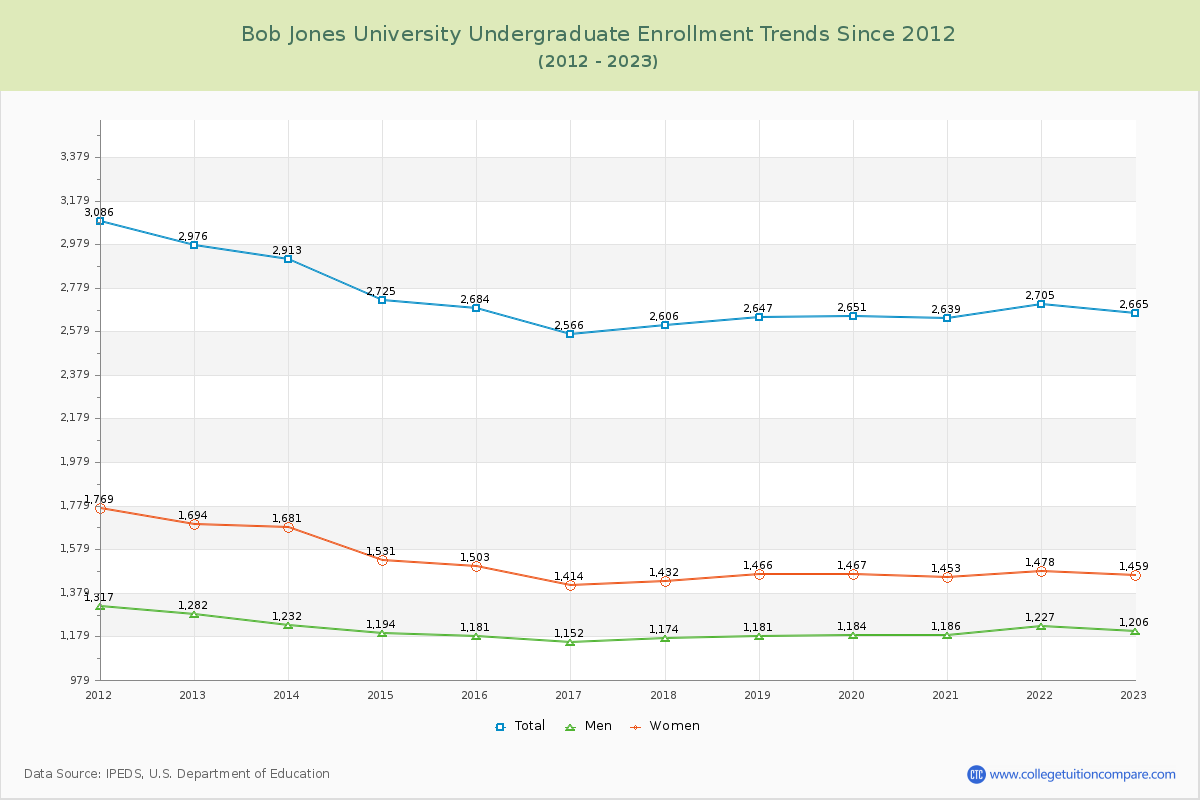
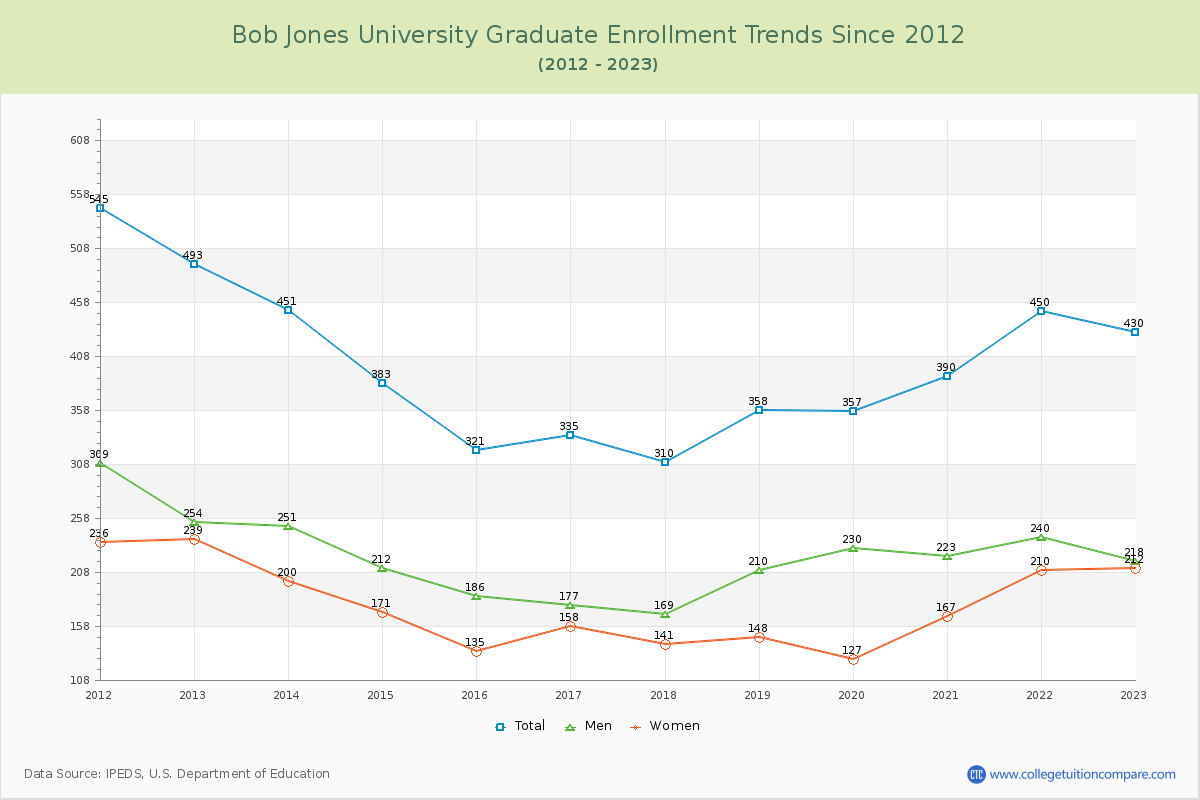
Student Population Changes
The average student population over the last 12 years is 3,096 where 3,095 students are attending the school for the academic year 2022-2023.
86.11% of total students is undergraduate students and 13.89% students is graduate students. The number of undergraduate students has decreased by 311 and the graduate enrollment has decreased by 63 over past 10 years.
The female to male ratio is 1.17 to 1 and it means that there are slightly more female students enrolled in Bob Jones than male students.
The following table and chart illustrate the changes in student population by gender at Bob Jones University since 2012.
| Year | Total | Undergraduate | Graduate | ||||
|---|---|---|---|---|---|---|---|
| Total | Men | Women | Total | Men | Women | ||
| 2012-13 | 3,469 | 2,976 | 1,282 | 1,694 | 493 | 254 | 239 |
| 2013-14 | 3,364 -105 | 2,913 -63 | 1,232 -50 | 1,681 -13 | 451 -42 | 251 -3 | 200 -39 |
| 2014-15 | 3,108 -256 | 2,725 -188 | 1,194 -38 | 1,531 -150 | 383 -68 | 212 -39 | 171 -29 |
| 2015-16 | 3,005 -103 | 2,684 -41 | 1,181 -13 | 1,503 -28 | 321 -62 | 186 -26 | 135 -36 |
| 2016-17 | 2,901 -104 | 2,566 -118 | 1,152 -29 | 1,414 -89 | 335 14 | 177 -9 | 158 23 |
| 2017-18 | 2,916 15 | 2,606 40 | 1,174 22 | 1,432 18 | 310 -25 | 169 -8 | 141 -17 |
| 2018-19 | 3,005 89 | 2,647 41 | 1,181 7 | 1,466 34 | 358 48 | 210 41 | 148 7 |
| 2019-20 | 3,008 3 | 2,651 4 | 1,184 3 | 1,467 1 | 357 -1 | 230 20 | 127 -21 |
| 2020-21 | 3,029 21 | 2,639 -12 | 1,186 2 | 1,453 -14 | 390 33 | 223 -7 | 167 40 |
| 2021-22 | 3,155 126 | 2,705 66 | 1,227 41 | 1,478 25 | 450 60 | 240 17 | 210 43 |
| 2022-23 | 3,095 -60 | 2,665 -40 | 1,206 -21 | 1,459 -19 | 430 -20 | 218 -22 | 212 2 |
| Average | 3,096 | 2,707 | 1,200 | 1,507 | 389 | 215 | 173 |