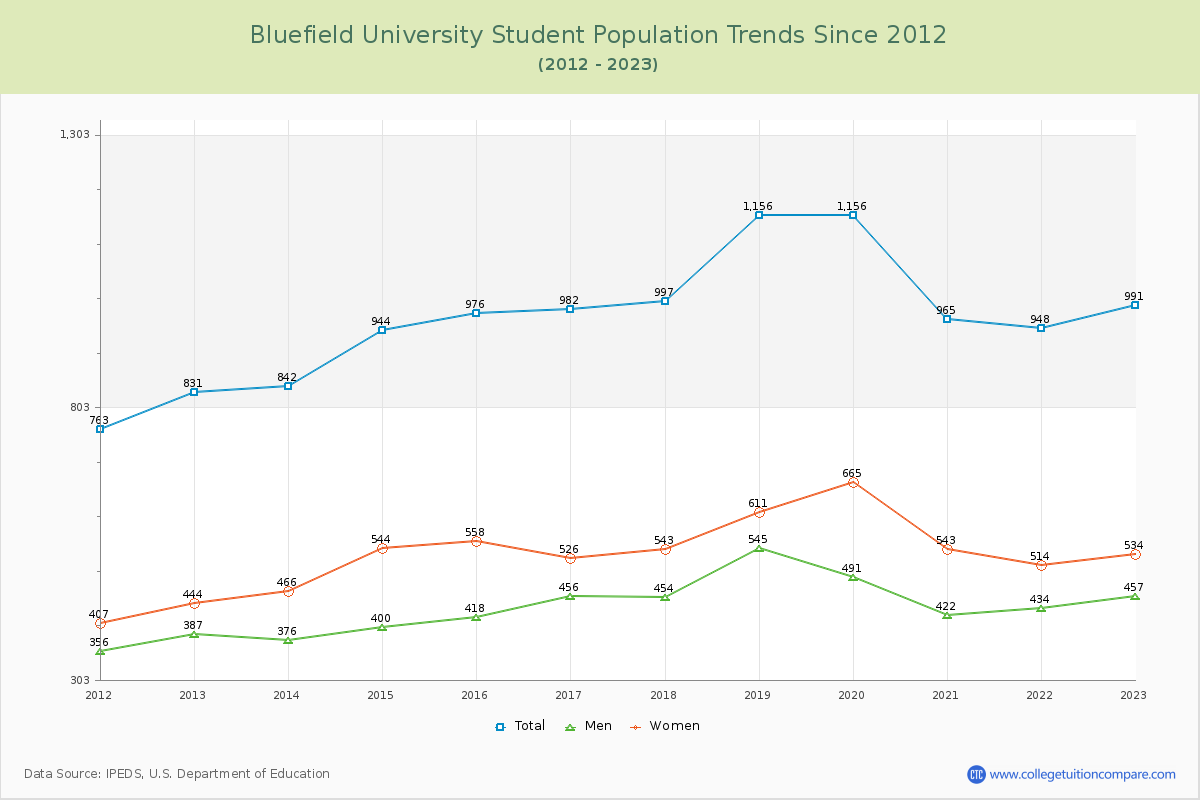
Student Population Changes
The average student population over the last 12 years is 981 where 991 students are attending the school for the academic year 2022-2023.
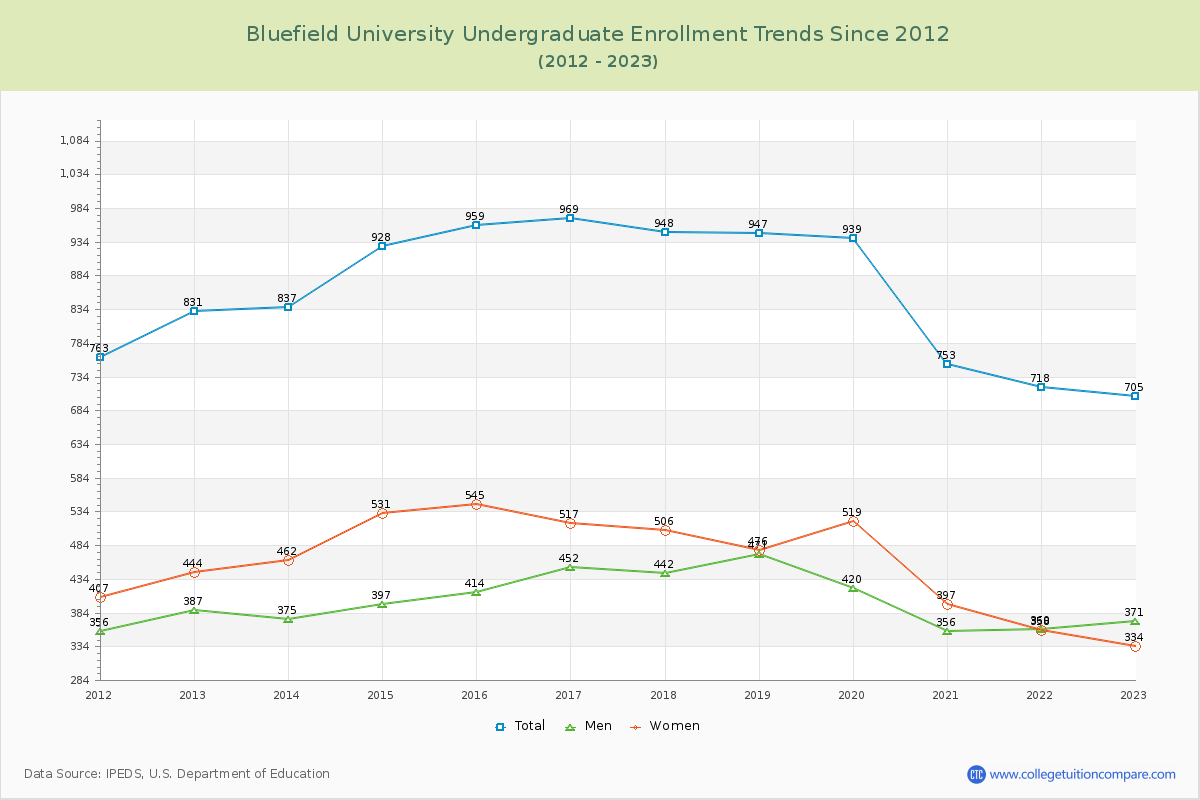
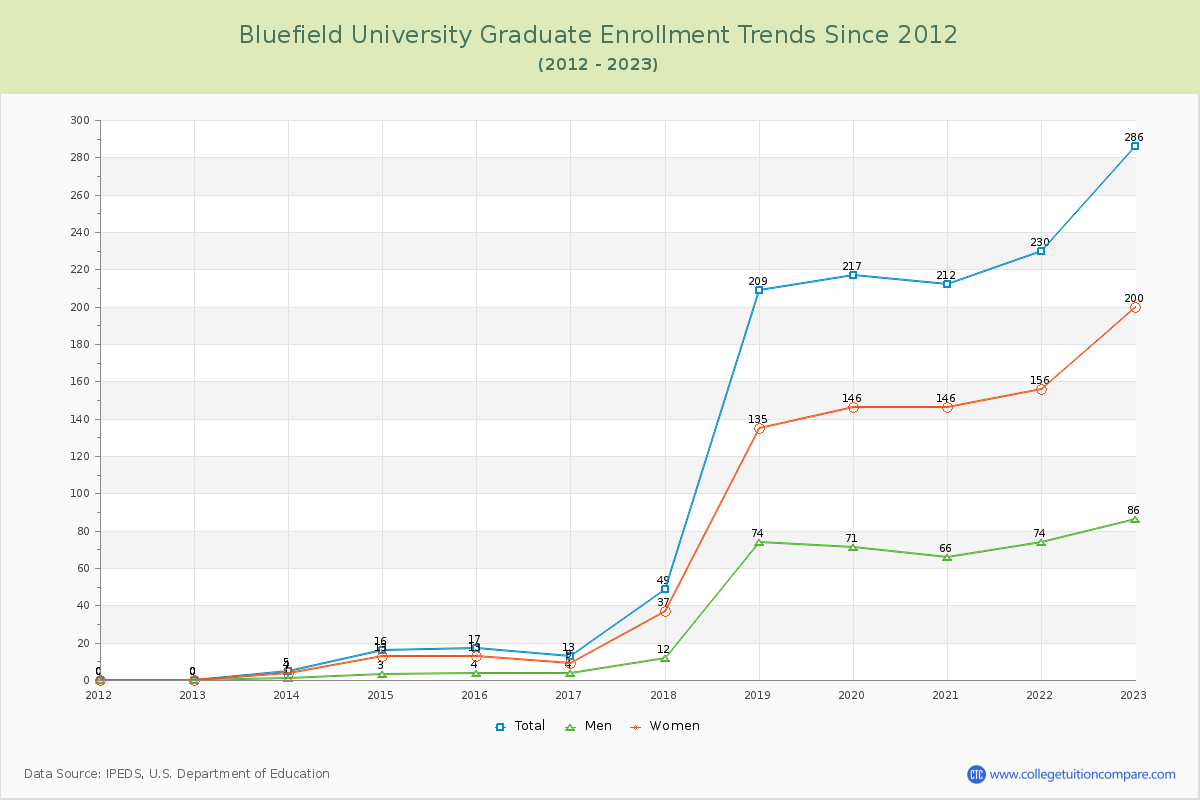
71.14% of total students is undergraduate students and 28.86% students is graduate students. The number of undergraduate students has decreased by 126 and the graduate enrollment has increased by 286 over past 10 years.
The female to male ratio is 1.17 to 1 and it means that there are slightly more female students enrolled in Bluefield than male students.
The following table and chart illustrate the changes in student population by gender at Bluefield University since 2012.
| Year | Total | Undergraduate | Graduate | ||||
|---|---|---|---|---|---|---|---|
| Total | Men | Women | Total | Men | Women | ||
| 2012-13 | 831 | 831 | 387 | 444 | 0 | 0 | 0 |
| 2013-14 | 842 11 | 837 6 | 375 -12 | 462 18 | 5 5 | 1 1 | 4 4 |
| 2014-15 | 944 102 | 928 91 | 397 22 | 531 69 | 16 11 | 3 2 | 13 9 |
| 2015-16 | 976 32 | 959 31 | 414 17 | 545 14 | 17 1 | 4 1 | 13 0 |
| 2016-17 | 982 6 | 969 10 | 452 38 | 517 -28 | 13 -4 | 4 0 | 9 -4 |
| 2017-18 | 997 15 | 948 -21 | 442 -10 | 506 -11 | 49 36 | 12 8 | 37 28 |
| 2018-19 | 1,156 159 | 947 -1 | 471 29 | 476 -30 | 209 160 | 74 62 | 135 98 |
| 2019-20 | 1,156 0 | 939 -8 | 420 -51 | 519 43 | 217 8 | 71 -3 | 146 11 |
| 2020-21 | 965 -191 | 753 -186 | 356 -64 | 397 -122 | 212 -5 | 66 -5 | 146 0 |
| 2021-22 | 948 -17 | 718 -35 | 360 4 | 358 -39 | 230 18 | 74 8 | 156 10 |
| 2022-23 | 991 43 | 705 -13 | 371 11 | 334 -24 | 286 56 | 86 12 | 200 44 |
| Average | 981 | 867 | 404 | 463 | 114 | 36 | 78 |