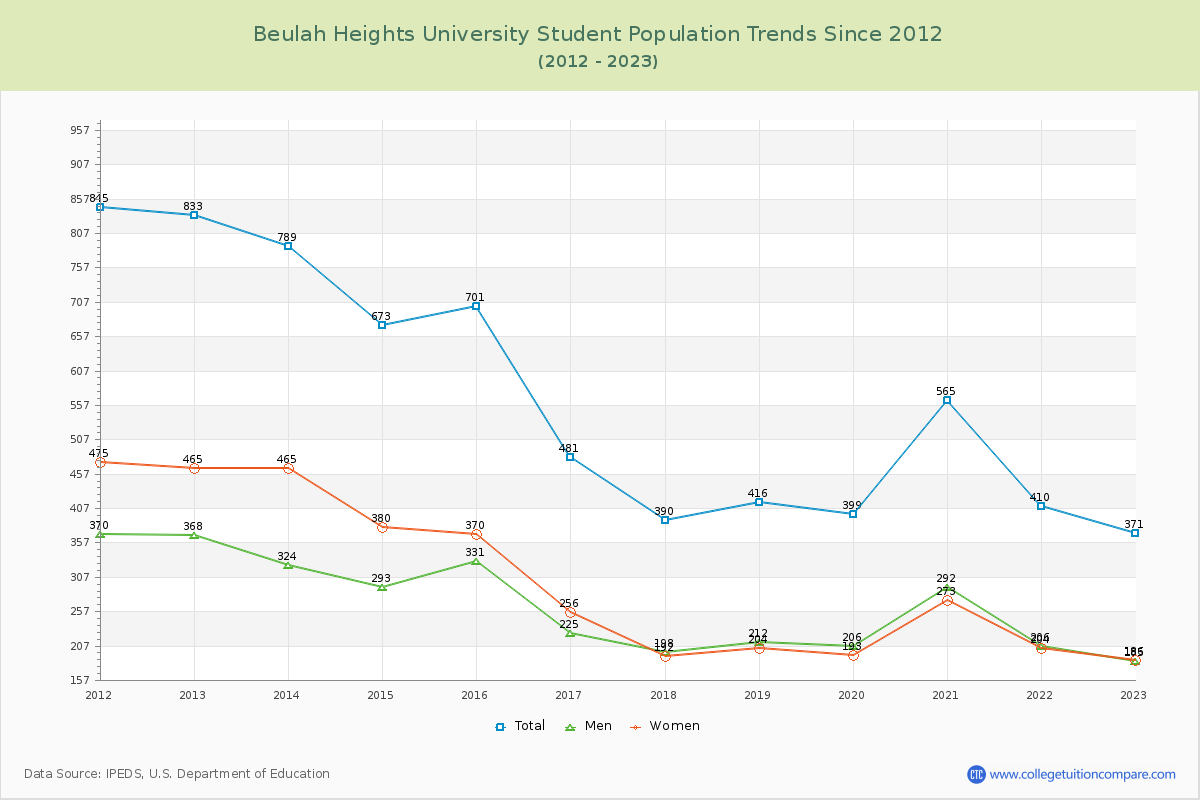
Student Population Changes
The average student population over the last 12 years is 548 where 371 students are attending the school for the academic year 2022-2023.
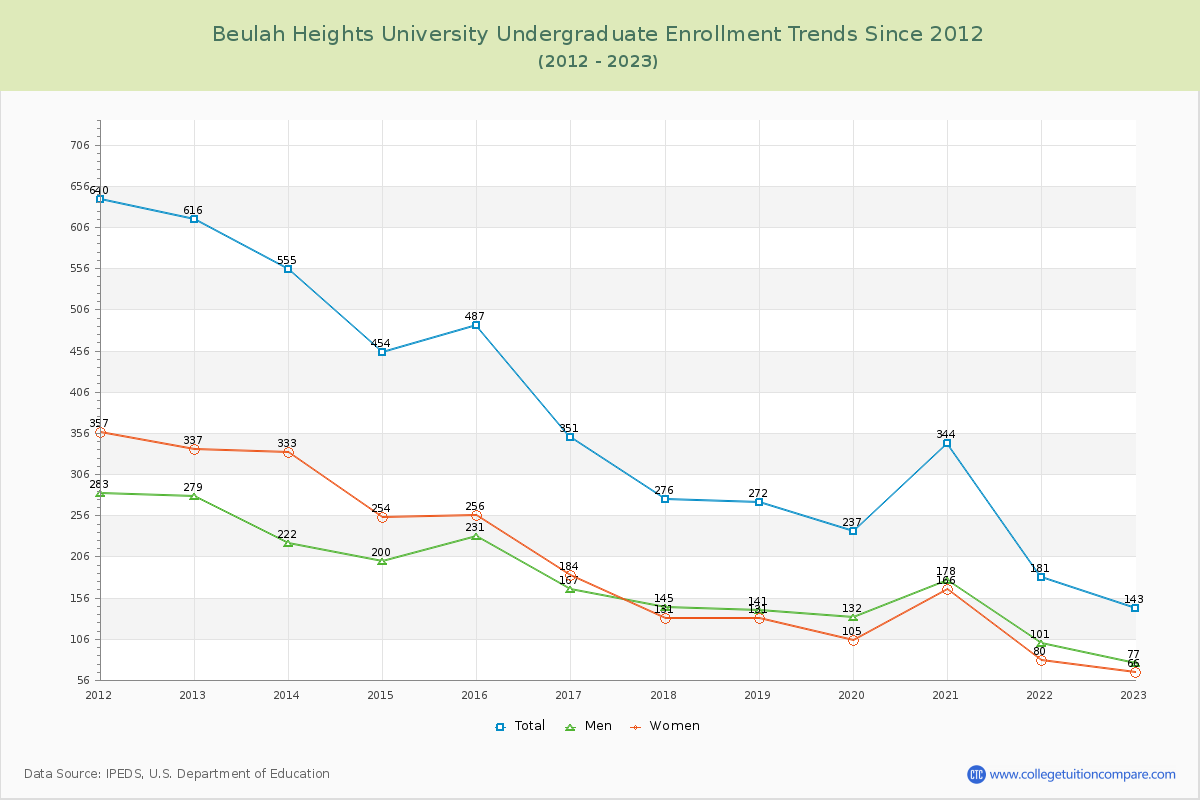
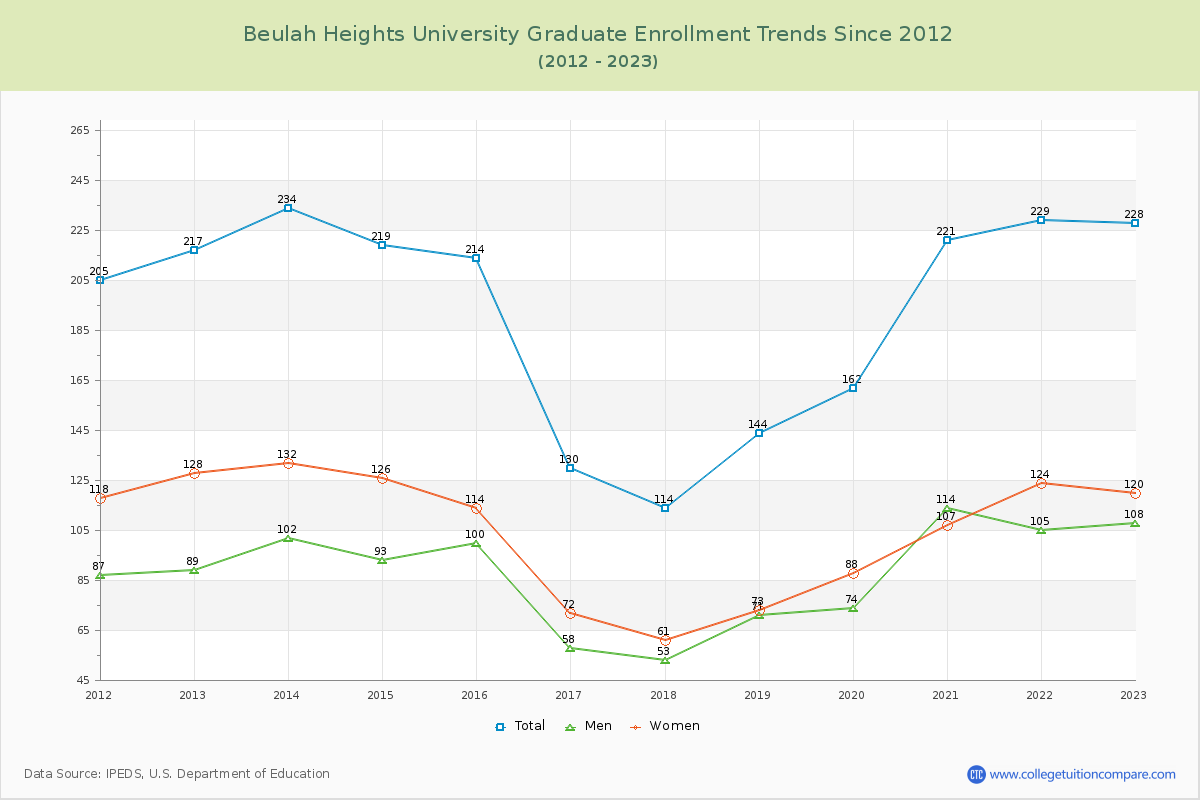
38.54% of total students is undergraduate students and 61.46% students is graduate students. The number of undergraduate students has decreased by 473 and the graduate enrollment has increased by 11 over past 10 years.
The female to male ratio is 1.01 to 1 and it means that there are similar numbers of female and male students enrolled in BHU.
The following table and chart illustrate the changes in student population by gender at Beulah Heights University since 2012.
| Year | Total | Undergraduate | Graduate | ||||
|---|---|---|---|---|---|---|---|
| Total | Men | Women | Total | Men | Women | ||
| 2012-13 | 833 | 616 | 279 | 337 | 217 | 89 | 128 |
| 2013-14 | 789 -44 | 555 -61 | 222 -57 | 333 -4 | 234 17 | 102 13 | 132 4 |
| 2014-15 | 673 -116 | 454 -101 | 200 -22 | 254 -79 | 219 -15 | 93 -9 | 126 -6 |
| 2015-16 | 701 28 | 487 33 | 231 31 | 256 2 | 214 -5 | 100 7 | 114 -12 |
| 2016-17 | 481 -220 | 351 -136 | 167 -64 | 184 -72 | 130 -84 | 58 -42 | 72 -42 |
| 2017-18 | 390 -91 | 276 -75 | 145 -22 | 131 -53 | 114 -16 | 53 -5 | 61 -11 |
| 2018-19 | 416 26 | 272 -4 | 141 -4 | 131 0 | 144 30 | 71 18 | 73 12 |
| 2019-20 | 399 -17 | 237 -35 | 132 -9 | 105 -26 | 162 18 | 74 3 | 88 15 |
| 2020-21 | 565 166 | 344 107 | 178 46 | 166 61 | 221 59 | 114 40 | 107 19 |
| 2021-22 | 410 -155 | 181 -163 | 101 -77 | 80 -86 | 229 8 | 105 -9 | 124 17 |
| 2022-23 | 371 -39 | 143 -38 | 77 -24 | 66 -14 | 228 -1 | 108 3 | 120 -4 |
| Average | 548 | 356 | 170 | 186 | 192 | 88 | 104 |