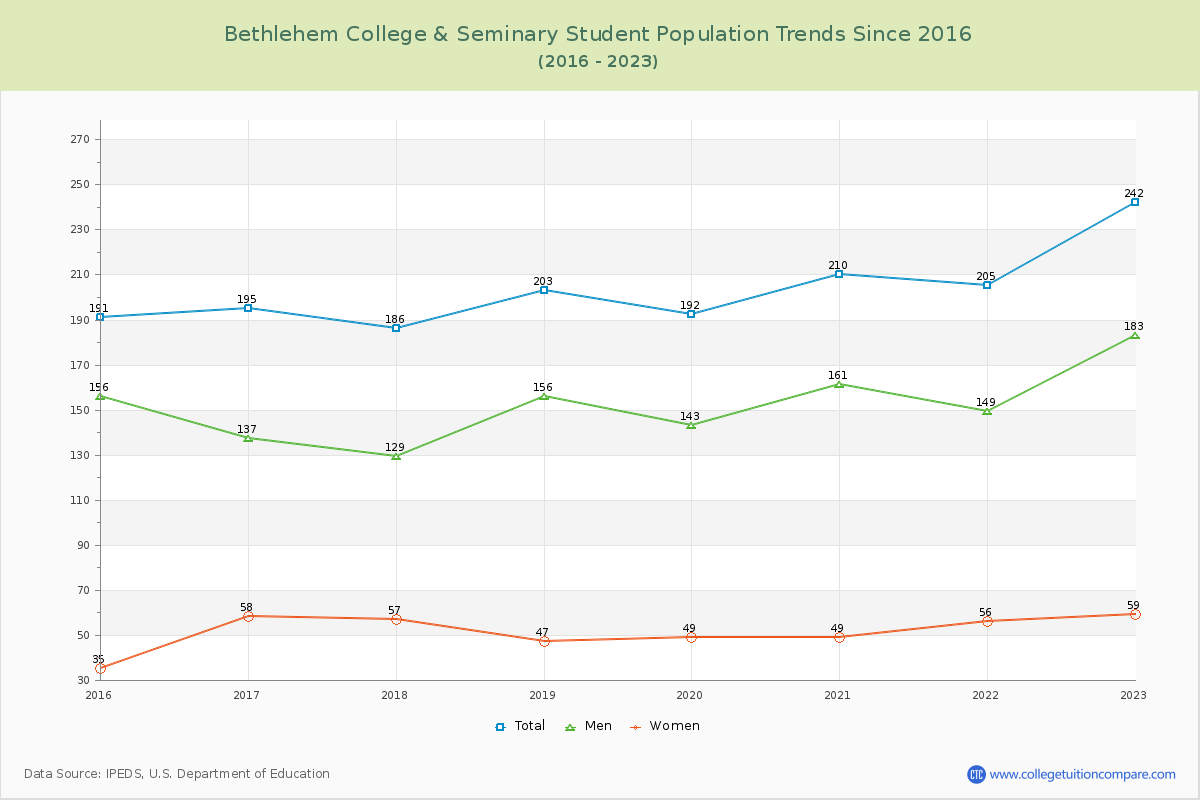
Student Population Changes
The average student population over the last 9 years is 203 where 242 students are attending the school for the academic year 2022-2023.
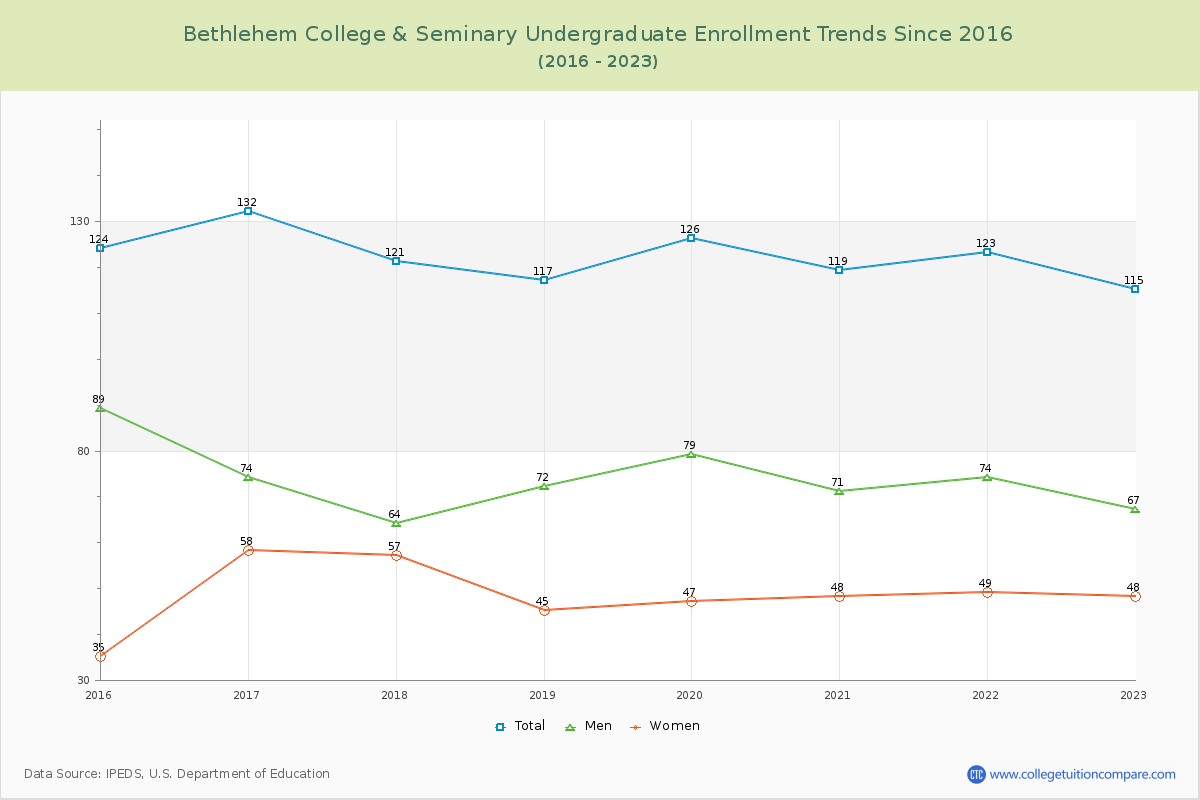
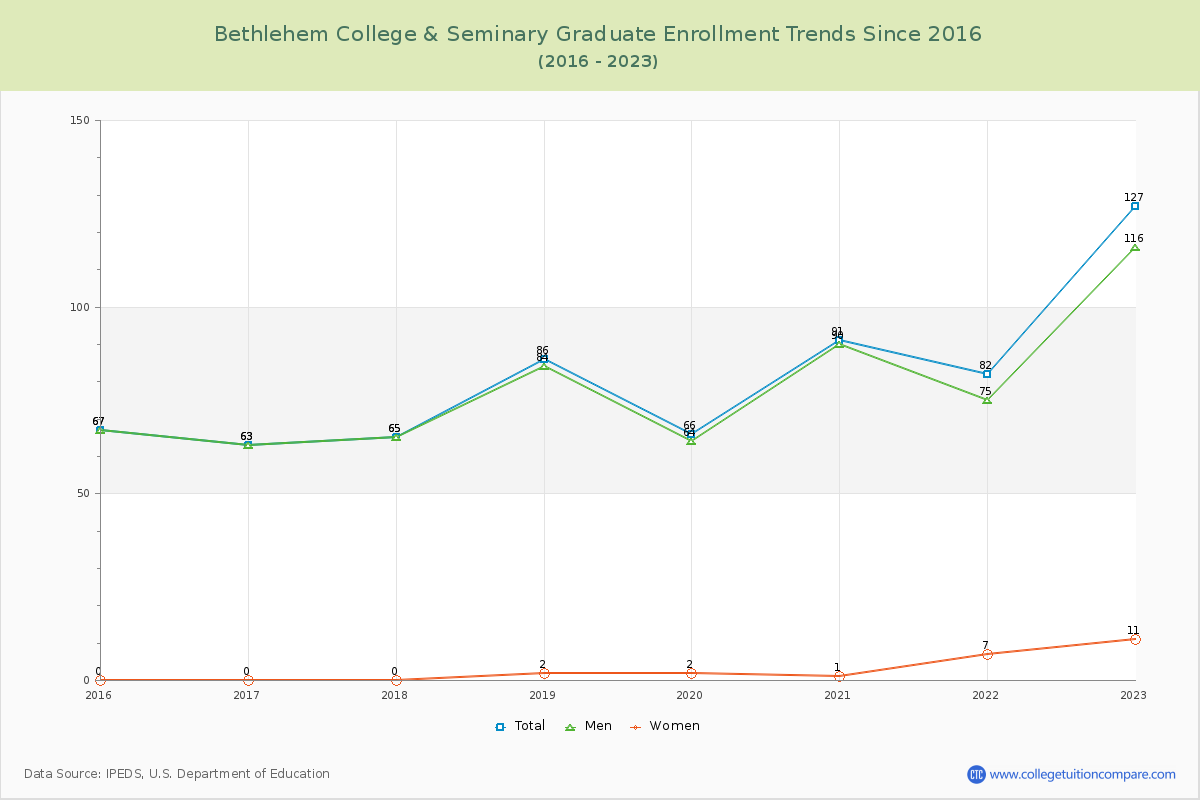
47.52% of total students is undergraduate students and 52.48% students is graduate students. The number of undergraduate students has decreased by 9 and the graduate enrollment has increased by 60 over past 10 years.
The female to male ratio is 0.32 to 1 and it means that there are far more male students enrolled in Bethlehem College & Seminary than female students.
The following table and chart illustrate the changes in student population by gender at Bethlehem College & Seminary since 2015.
| Year | Total | Undergraduate | Graduate | ||||
|---|---|---|---|---|---|---|---|
| Total | Men | Women | Total | Men | Women | ||
| 2015-16 | 191 | 124 | 89 | 35 | 67 | 67 | 0 |
| 2016-17 | 195 4 | 132 8 | 74 -15 | 58 23 | 63 -4 | 63 -4 | 0 0 |
| 2017-18 | 186 -9 | 121 -11 | 64 -10 | 57 -1 | 65 2 | 65 2 | 0 0 |
| 2018-19 | 203 17 | 117 -4 | 72 8 | 45 -12 | 86 21 | 84 19 | 2 2 |
| 2019-20 | 192 -11 | 126 9 | 79 7 | 47 2 | 66 -20 | 64 -20 | 2 0 |
| 2020-21 | 210 18 | 119 -7 | 71 -8 | 48 1 | 91 25 | 90 26 | 1 -1 |
| 2021-22 | 205 -5 | 123 4 | 74 3 | 49 1 | 82 -9 | 75 -15 | 7 6 |
| 2022-23 | 242 37 | 115 -8 | 67 -7 | 48 -1 | 127 45 | 116 41 | 11 4 |
| Average | 203 | 122 | 74 | 48 | 81 | 78 | 3 |