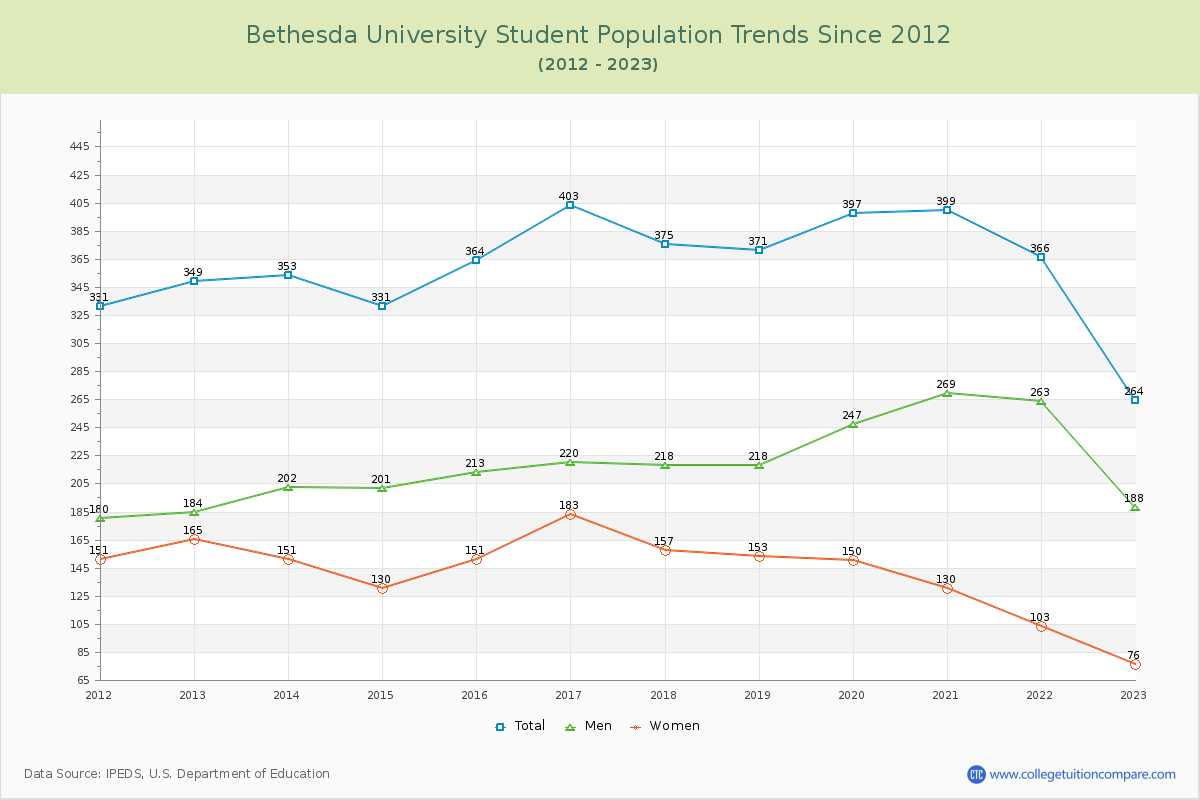
Student Population Changes
The average student population over the last 12 years is 361 where 264 students are attending the school for the academic year 2022-2023.
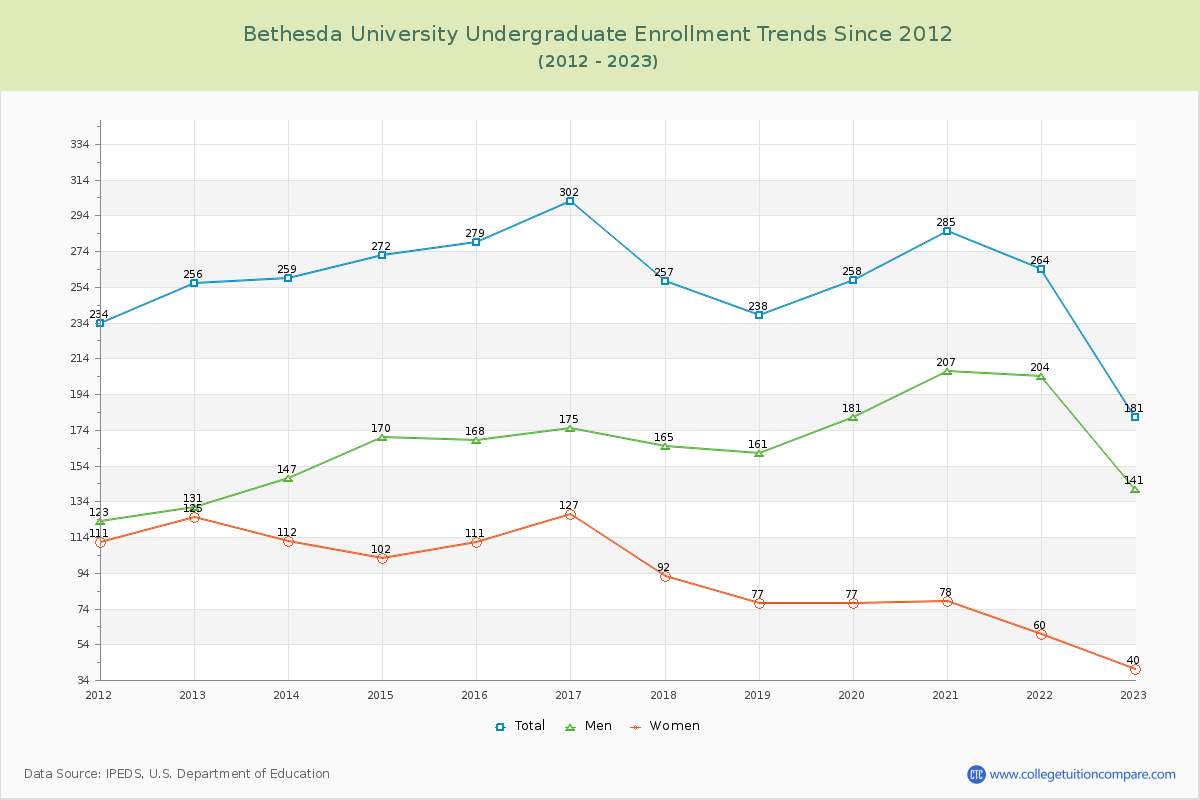
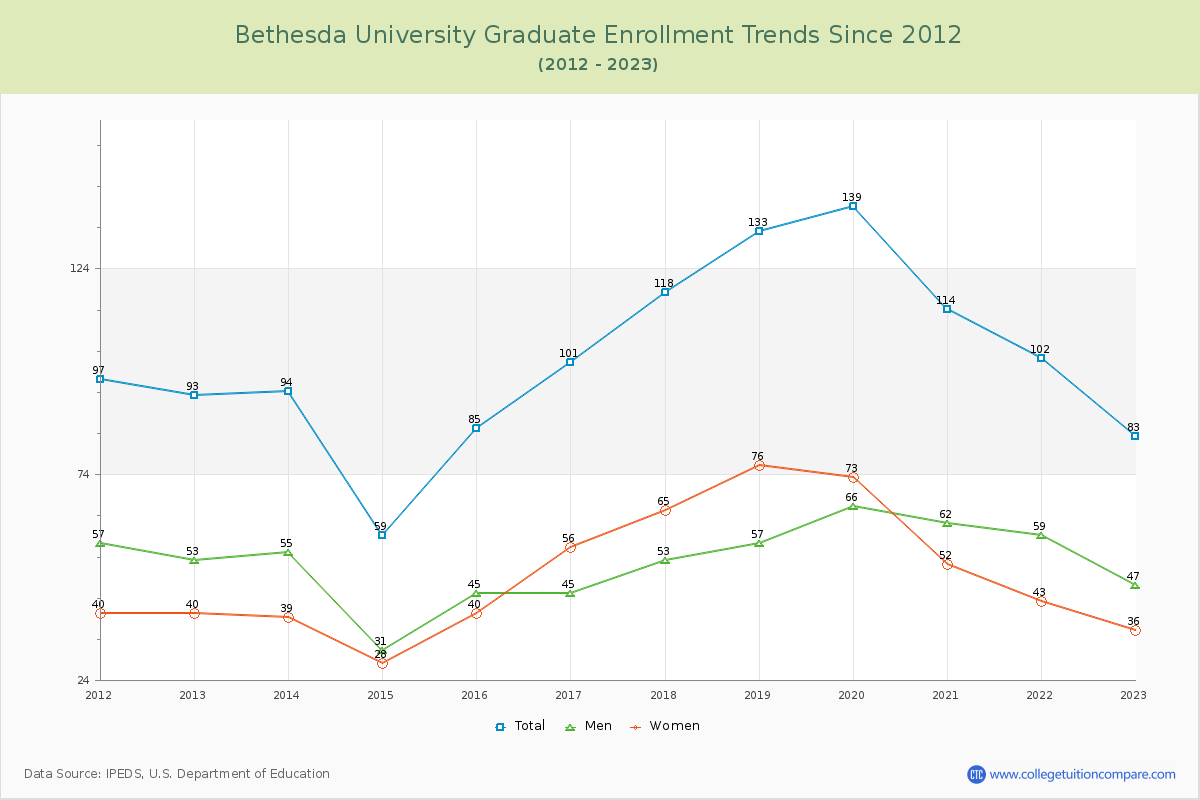
68.56% of total students is undergraduate students and 31.44% students is graduate students. The number of undergraduate students has decreased by 75 and the graduate enrollment has decreased by 10 over past 10 years.
The female to male ratio is 0.40 to 1 and it means that there are far more male students enrolled in Bethesda than female students.
The following table and chart illustrate the changes in student population by gender at Bethesda University since 2012.
| Year | Total | Undergraduate | Graduate | ||||
|---|---|---|---|---|---|---|---|
| Total | Men | Women | Total | Men | Women | ||
| 2012-13 | 349 | 256 | 131 | 125 | 93 | 53 | 40 |
| 2013-14 | 353 4 | 259 3 | 147 16 | 112 -13 | 94 1 | 55 2 | 39 -1 |
| 2014-15 | 331 -22 | 272 13 | 170 23 | 102 -10 | 59 -35 | 31 -24 | 28 -11 |
| 2015-16 | 364 33 | 279 7 | 168 -2 | 111 9 | 85 26 | 45 14 | 40 12 |
| 2016-17 | 403 39 | 302 23 | 175 7 | 127 16 | 101 16 | 45 0 | 56 16 |
| 2017-18 | 375 -28 | 257 -45 | 165 -10 | 92 -35 | 118 17 | 53 8 | 65 9 |
| 2018-19 | 371 -4 | 238 -19 | 161 -4 | 77 -15 | 133 15 | 57 4 | 76 11 |
| 2019-20 | 397 26 | 258 20 | 181 20 | 77 0 | 139 6 | 66 9 | 73 -3 |
| 2020-21 | 399 2 | 285 27 | 207 26 | 78 1 | 114 -25 | 62 -4 | 52 -21 |
| 2021-22 | 366 -33 | 264 -21 | 204 -3 | 60 -18 | 102 -12 | 59 -3 | 43 -9 |
| 2022-23 | 264 -102 | 181 -83 | 141 -63 | 40 -20 | 83 -19 | 47 -12 | 36 -7 |
| Average | 361 | 259 | 168 | 91 | 102 | 52 | 50 |