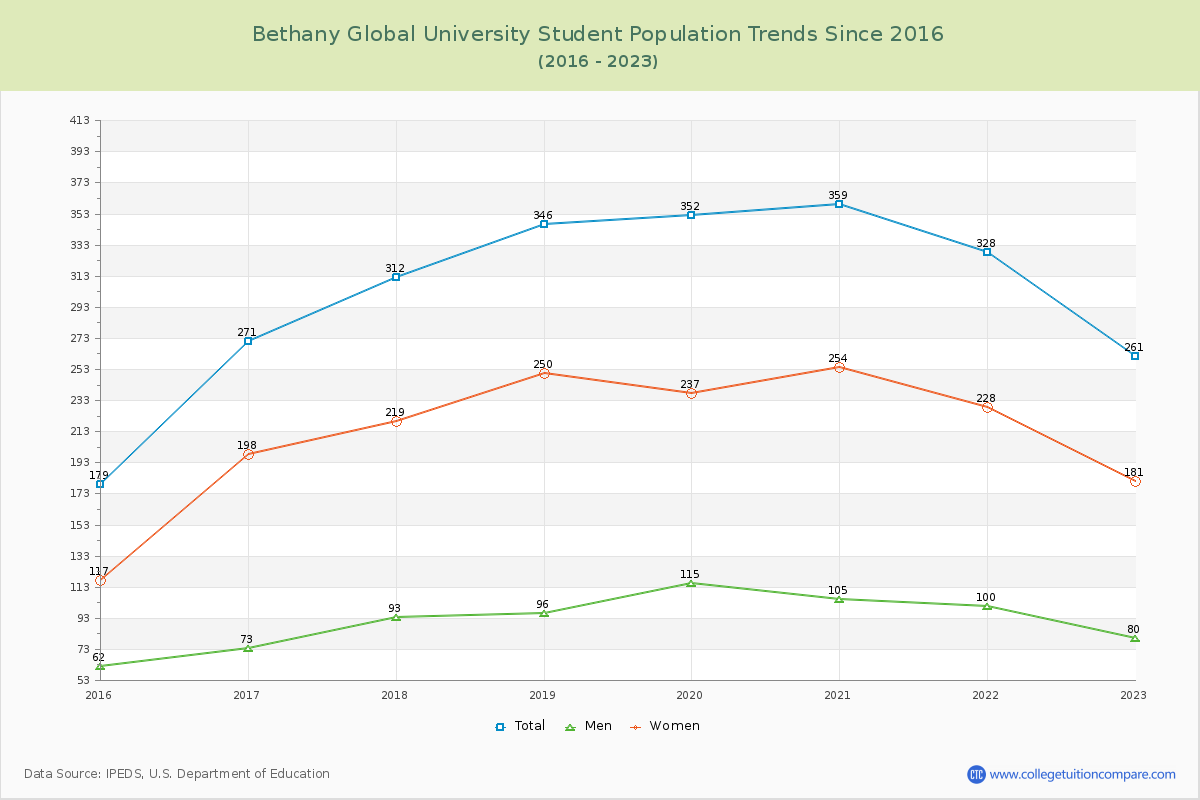
Student Population Changes
The average student population over the last 9 years is 301 where 261 students are attending the school for the academic year 2022-2023.
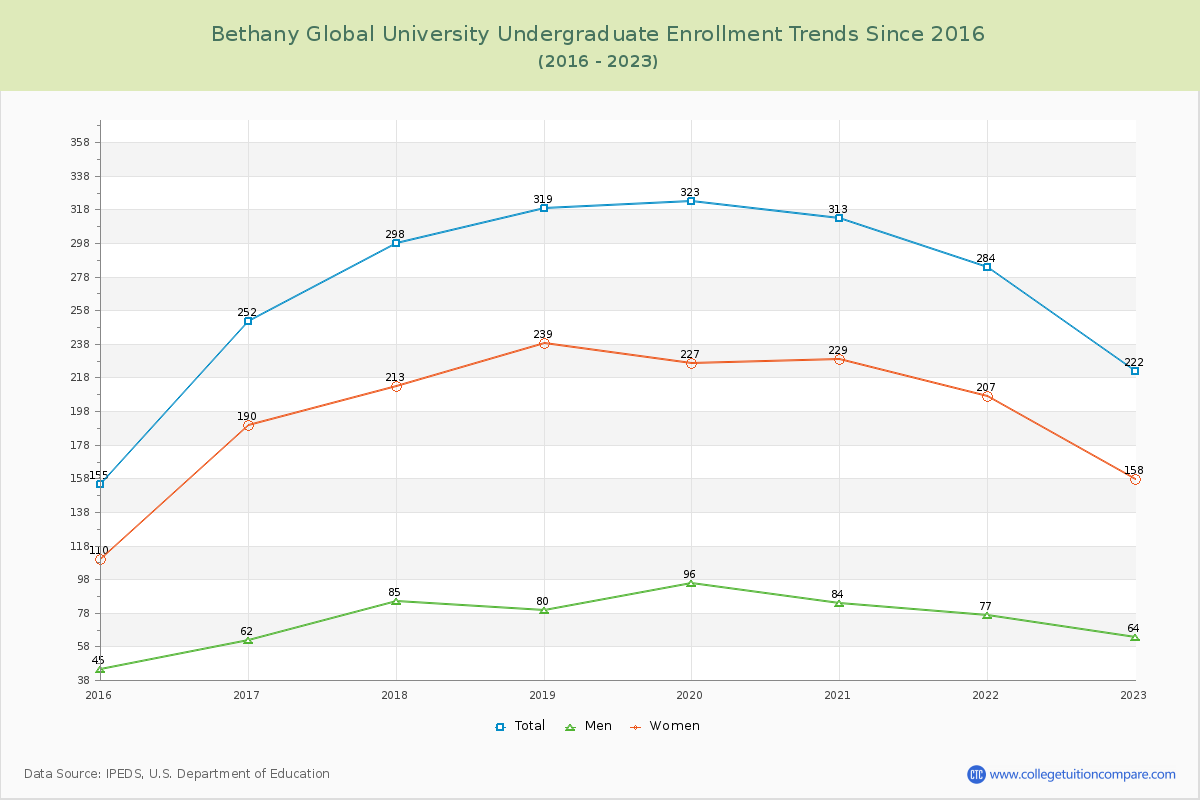
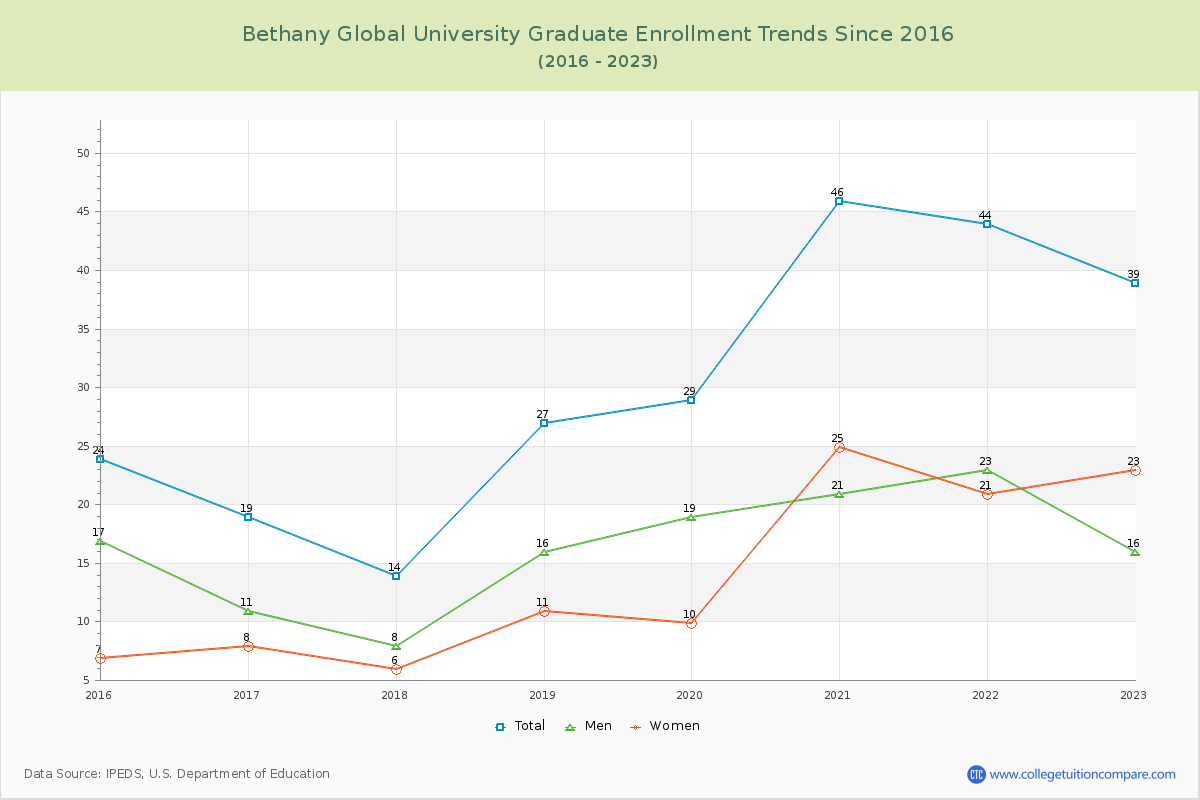
85.06% of total students is undergraduate students and 14.94% students is graduate students. The number of undergraduate students has increased by 67 and the graduate enrollment has increased by 15 over past 10 years.
The female to male ratio is 2.26 to 1 and it means that there are far more female students enrolled in BGU than male students.
The following table and chart illustrate the changes in student population by gender at Bethany Global University since 2015.
| Year | Total | Undergraduate | Graduate | ||||
|---|---|---|---|---|---|---|---|
| Total | Men | Women | Total | Men | Women | ||
| 2015-16 | 179 | 155 | 45 | 110 | 24 | 17 | 7 |
| 2016-17 | 271 92 | 252 97 | 62 17 | 190 80 | 19 -5 | 11 -6 | 8 1 |
| 2017-18 | 312 41 | 298 46 | 85 23 | 213 23 | 14 -5 | 8 -3 | 6 -2 |
| 2018-19 | 346 34 | 319 21 | 80 -5 | 239 26 | 27 13 | 16 8 | 11 5 |
| 2019-20 | 352 6 | 323 4 | 96 16 | 227 -12 | 29 2 | 19 3 | 10 -1 |
| 2020-21 | 359 7 | 313 -10 | 84 -12 | 229 2 | 46 17 | 21 2 | 25 15 |
| 2021-22 | 328 -31 | 284 -29 | 77 -7 | 207 -22 | 44 -2 | 23 2 | 21 -4 |
| 2022-23 | 261 -67 | 222 -62 | 64 -13 | 158 -49 | 39 -5 | 16 -7 | 23 2 |
| Average | 301 | 271 | 74 | 197 | 30 | 16 | 14 |