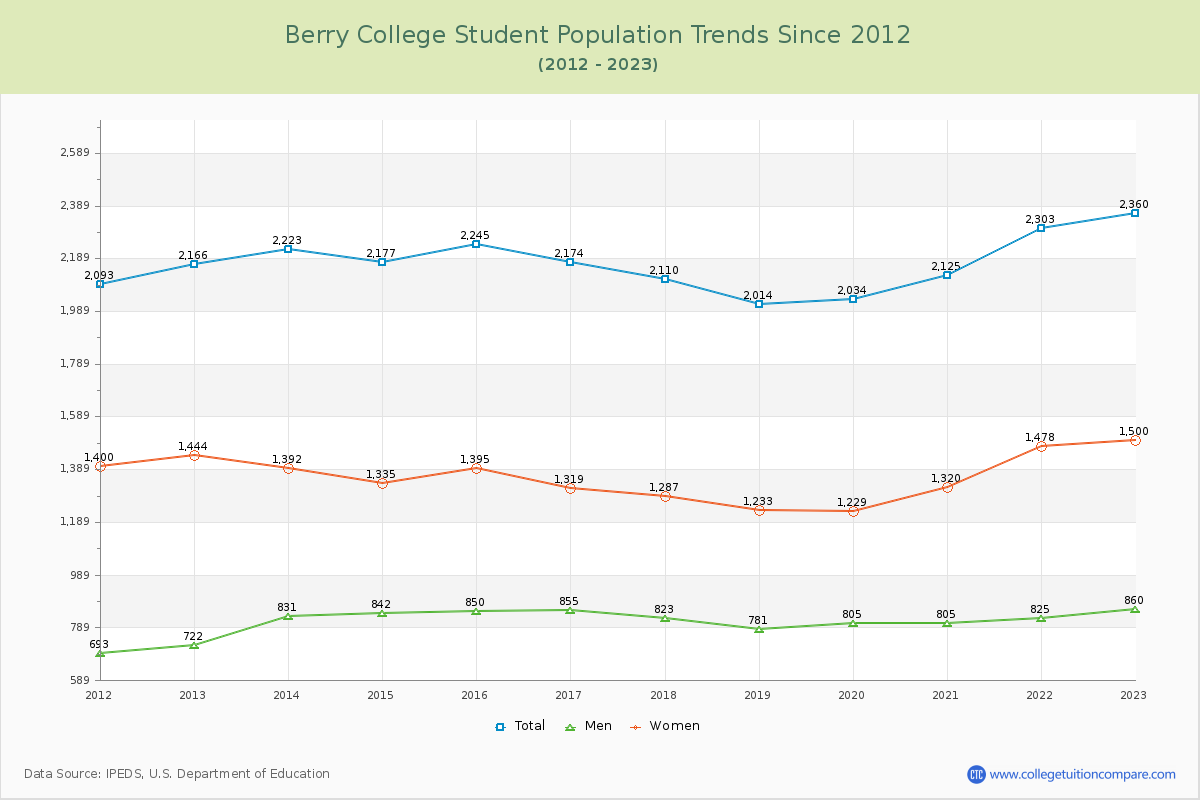
Student Population Changes
The average student population over the last 12 years is 2,176 where 2,360 students are attending the school for the academic year 2022-2023.
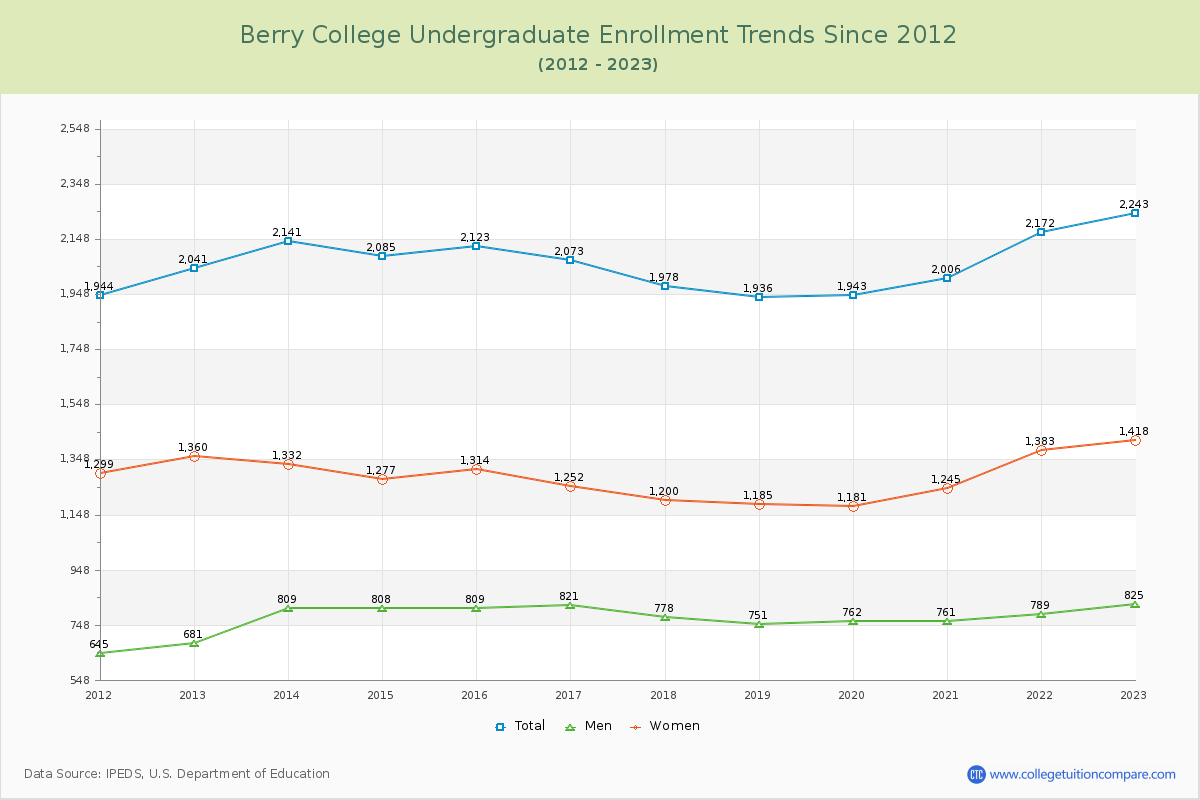
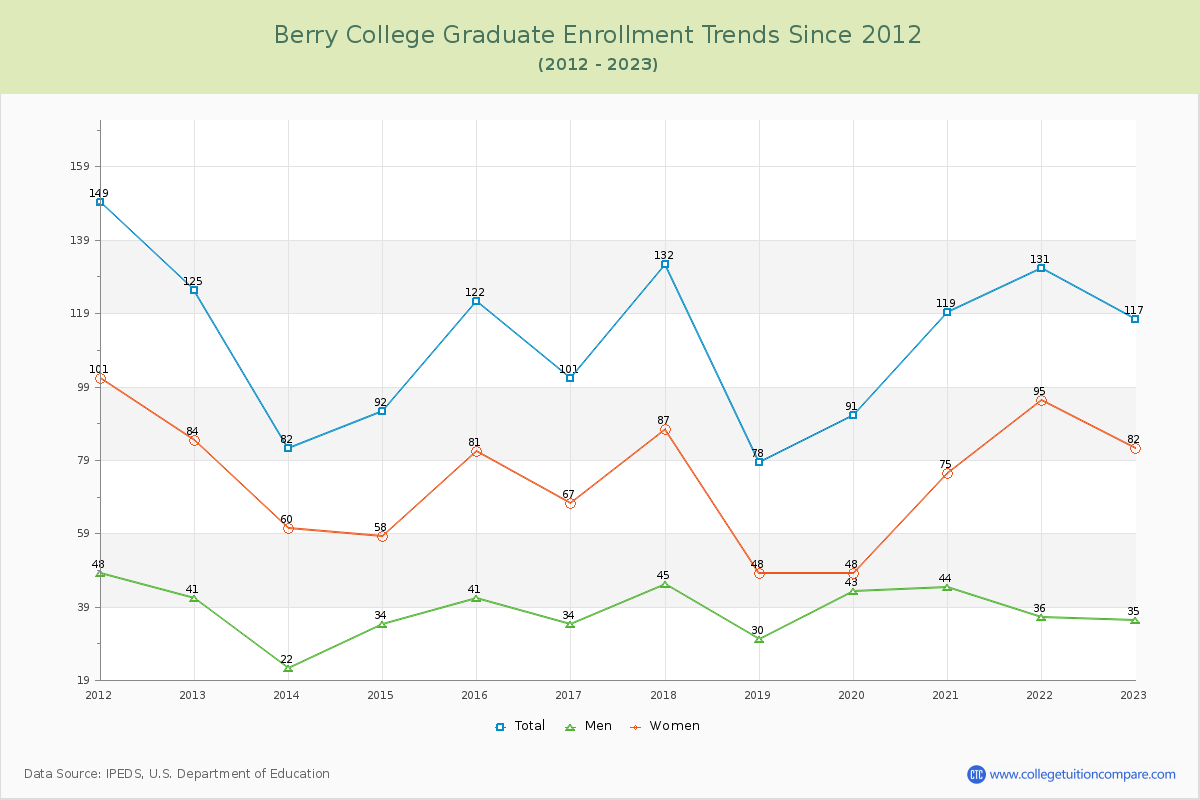
95.04% of total students is undergraduate students and 4.96% students is graduate students. The number of undergraduate students has increased by 202 and the graduate enrollment has decreased by 8 over past 10 years.
The female to male ratio is 1.74 to 1 and it means that there are more female students enrolled in Berry than male students.
The following table and chart illustrate the changes in student population by gender at Berry College since 2012.
| Year | Total | Undergraduate | Graduate | ||||
|---|---|---|---|---|---|---|---|
| Total | Men | Women | Total | Men | Women | ||
| 2012-13 | 2,166 | 2,041 | 681 | 1,360 | 125 | 41 | 84 |
| 2013-14 | 2,223 57 | 2,141 100 | 809 128 | 1,332 -28 | 82 -43 | 22 -19 | 60 -24 |
| 2014-15 | 2,177 -46 | 2,085 -56 | 808 -1 | 1,277 -55 | 92 10 | 34 12 | 58 -2 |
| 2015-16 | 2,245 68 | 2,123 38 | 809 1 | 1,314 37 | 122 30 | 41 7 | 81 23 |
| 2016-17 | 2,174 -71 | 2,073 -50 | 821 12 | 1,252 -62 | 101 -21 | 34 -7 | 67 -14 |
| 2017-18 | 2,110 -64 | 1,978 -95 | 778 -43 | 1,200 -52 | 132 31 | 45 11 | 87 20 |
| 2018-19 | 2,014 -96 | 1,936 -42 | 751 -27 | 1,185 -15 | 78 -54 | 30 -15 | 48 -39 |
| 2019-20 | 2,034 20 | 1,943 7 | 762 11 | 1,181 -4 | 91 13 | 43 13 | 48 0 |
| 2020-21 | 2,125 91 | 2,006 63 | 761 -1 | 1,245 64 | 119 28 | 44 1 | 75 27 |
| 2021-22 | 2,303 178 | 2,172 166 | 789 28 | 1,383 138 | 131 12 | 36 -8 | 95 20 |
| 2022-23 | 2,360 57 | 2,243 71 | 825 36 | 1,418 35 | 117 -14 | 35 -1 | 82 -13 |
| Average | 2,176 | 2,067 | 781 | 1,286 | 108 | 37 | 71 |