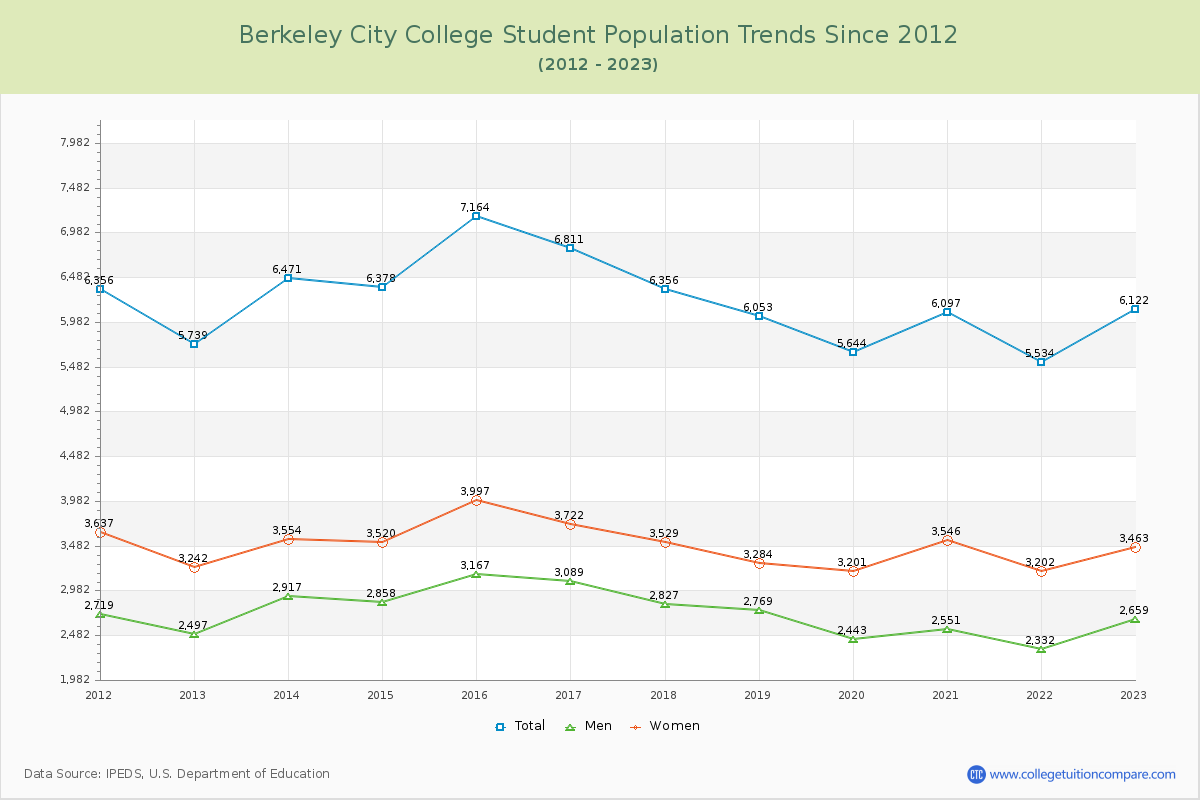
Student Population Changes
The average student population over the last 12 years is 6,215 where 6,122 students are attending the school for the academic year 2022-2023.
The female to male ratio is 1.30 to 1 and it means that there are slightly more female students enrolled in Berkeley City than male students.
The following table and chart illustrate the changes in student population by gender at Berkeley City College since 2012.
| Year | Total | Men | Women |
|---|---|---|---|
| 2012-13 | 5,739 | 2,497 | 3,242 |
| 2013-14 | 6,471 732 | 2,917 420 | 3,554 312 |
| 2014-15 | 6,378 -93 | 2,858 -59 | 3,520 -34 |
| 2015-16 | 7,164 786 | 3,167 309 | 3,997 477 |
| 2016-17 | 6,811 -353 | 3,089 -78 | 3,722 -275 |
| 2017-18 | 6,356 -455 | 2,827 -262 | 3,529 -193 |
| 2018-19 | 6,053 -303 | 2,769 -58 | 3,284 -245 |
| 2019-20 | 5,644 -409 | 2,443 -326 | 3,201 -83 |
| 2020-21 | 6,097 453 | 2,551 108 | 3,546 345 |
| 2021-22 | 5,534 -563 | 2,332 -219 | 3,202 -344 |
| 2022-23 | 6,122 588 | 2,659 327 | 3,463 261 |
| Average | 6,215 | 2,737 | 3,478 |