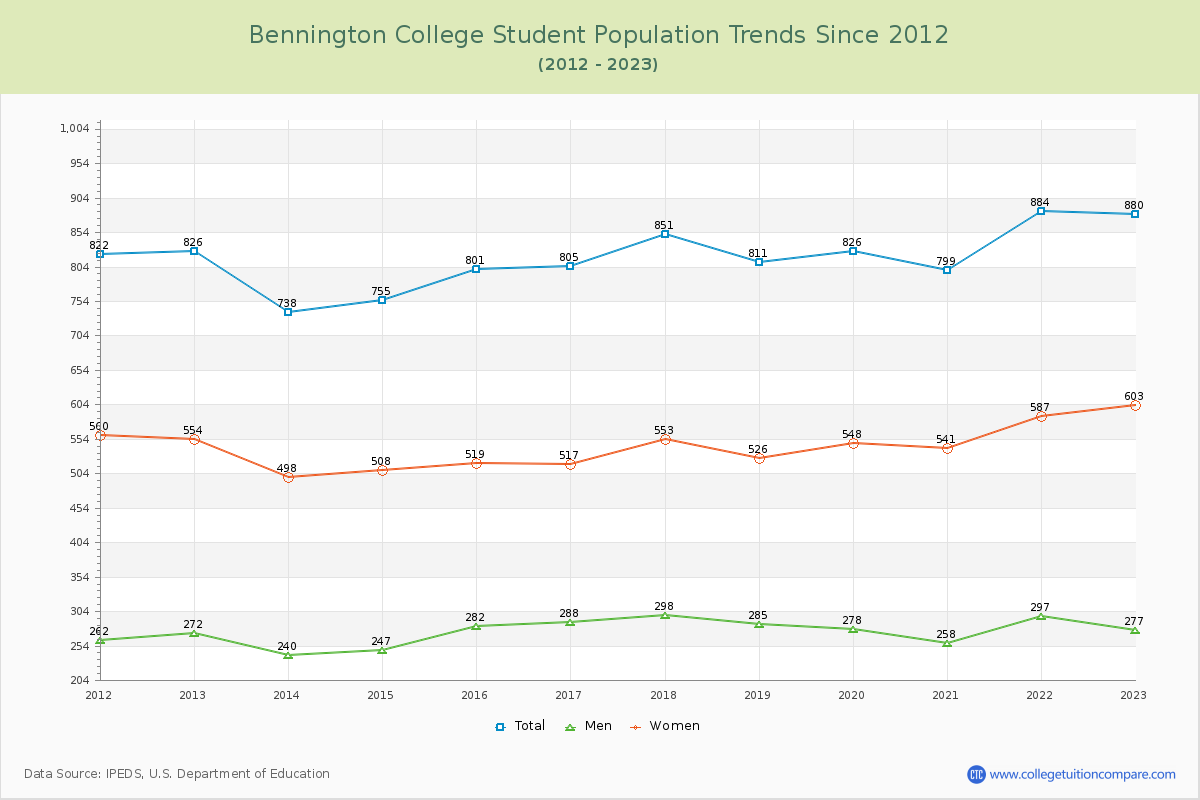
Student Population Changes
The average student population over the last 12 years is 816 where 880 students are attending the school for the academic year 2022-2023.
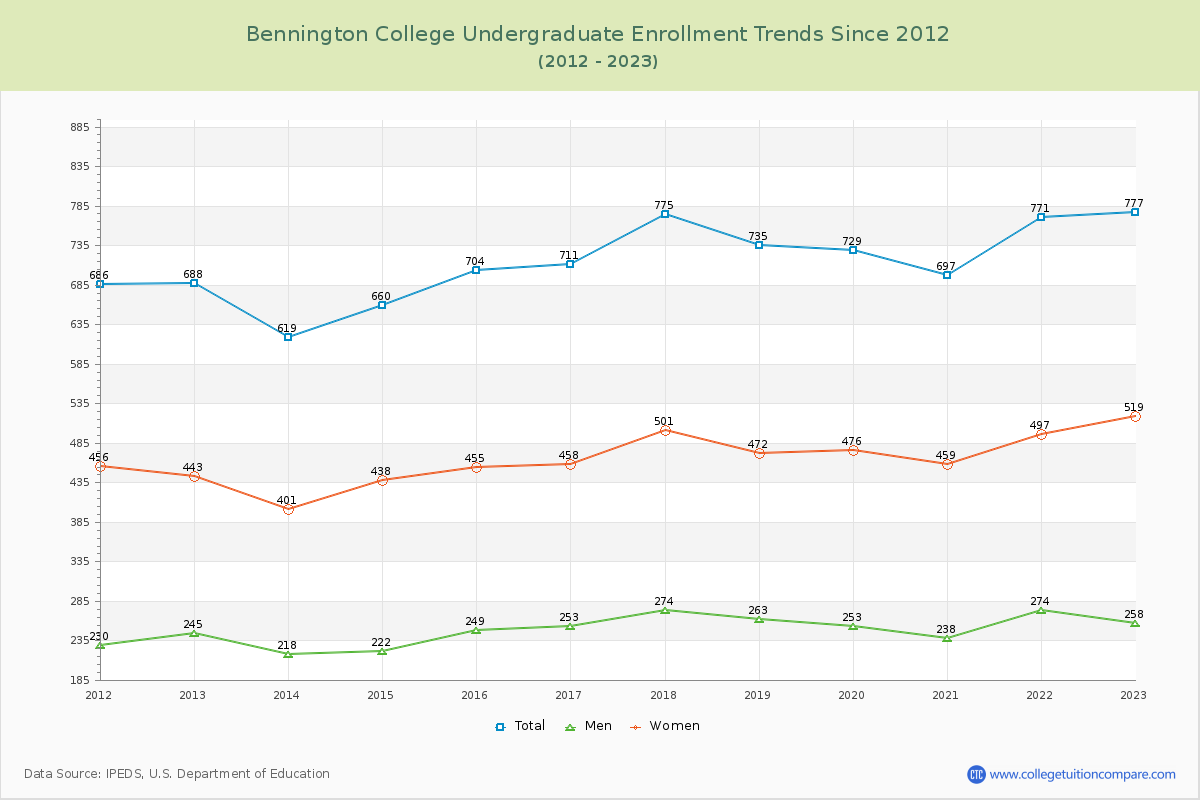
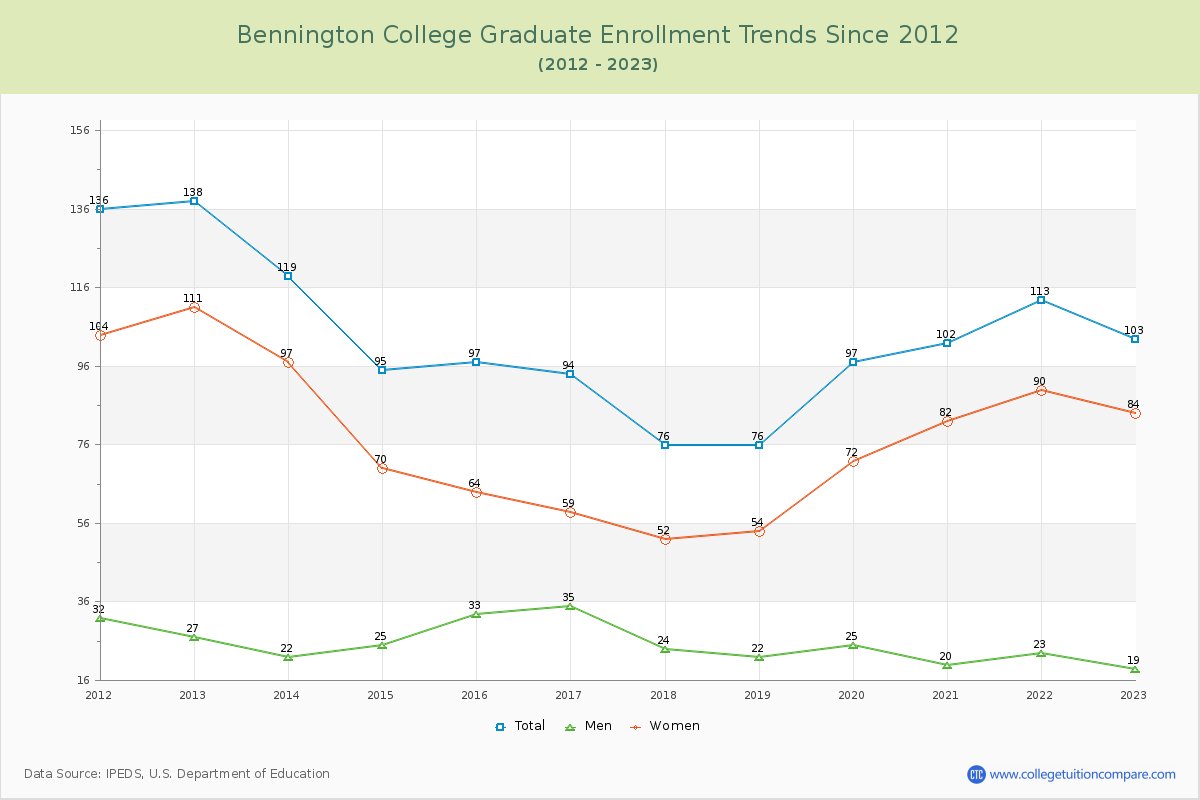
88.30% of total students is undergraduate students and 11.70% students is graduate students. The number of undergraduate students has increased by 89 and the graduate enrollment has decreased by 35 over past 10 years.
The female to male ratio is 2.18 to 1 and it means that there are far more female students enrolled in Bennington than male students.
The following table and chart illustrate the changes in student population by gender at Bennington College since 2012.
| Year | Total | Undergraduate | Graduate | ||||
|---|---|---|---|---|---|---|---|
| Total | Men | Women | Total | Men | Women | ||
| 2012-13 | 826 | 688 | 245 | 443 | 138 | 27 | 111 |
| 2013-14 | 738 -88 | 619 -69 | 218 -27 | 401 -42 | 119 -19 | 22 -5 | 97 -14 |
| 2014-15 | 755 17 | 660 41 | 222 4 | 438 37 | 95 -24 | 25 3 | 70 -27 |
| 2015-16 | 801 46 | 704 44 | 249 27 | 455 17 | 97 2 | 33 8 | 64 -6 |
| 2016-17 | 805 4 | 711 7 | 253 4 | 458 3 | 94 -3 | 35 2 | 59 -5 |
| 2017-18 | 851 46 | 775 64 | 274 21 | 501 43 | 76 -18 | 24 -11 | 52 -7 |
| 2018-19 | 811 -40 | 735 -40 | 263 -11 | 472 -29 | 76 0 | 22 -2 | 54 2 |
| 2019-20 | 826 15 | 729 -6 | 253 -10 | 476 4 | 97 21 | 25 3 | 72 18 |
| 2020-21 | 799 -27 | 697 -32 | 238 -15 | 459 -17 | 102 5 | 20 -5 | 82 10 |
| 2021-22 | 884 85 | 771 74 | 274 36 | 497 38 | 113 11 | 23 3 | 90 8 |
| 2022-23 | 880 -4 | 777 6 | 258 -16 | 519 22 | 103 -10 | 19 -4 | 84 -6 |
| Average | 816 | 715 | 250 | 465 | 101 | 25 | 76 |