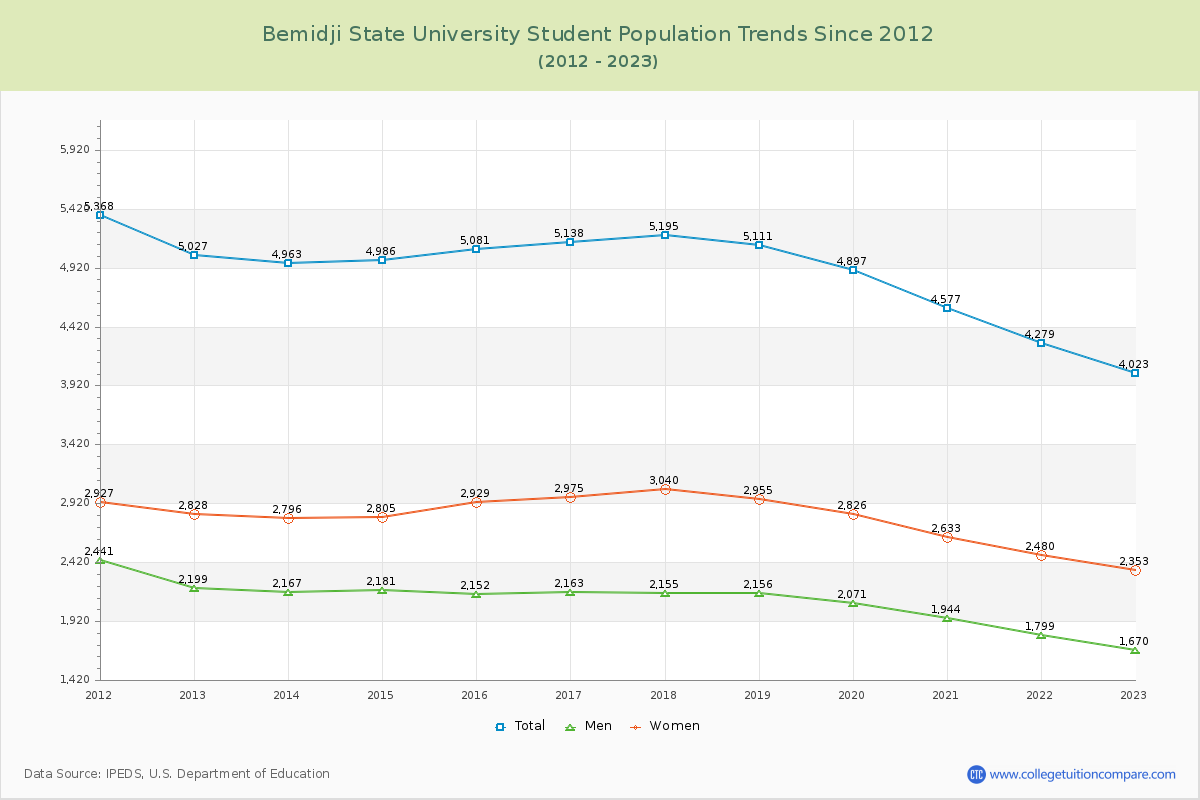
Student Population Changes
The average student population over the last 12 years is 4,843 where 4,023 students are attending the school for the academic year 2022-2023.
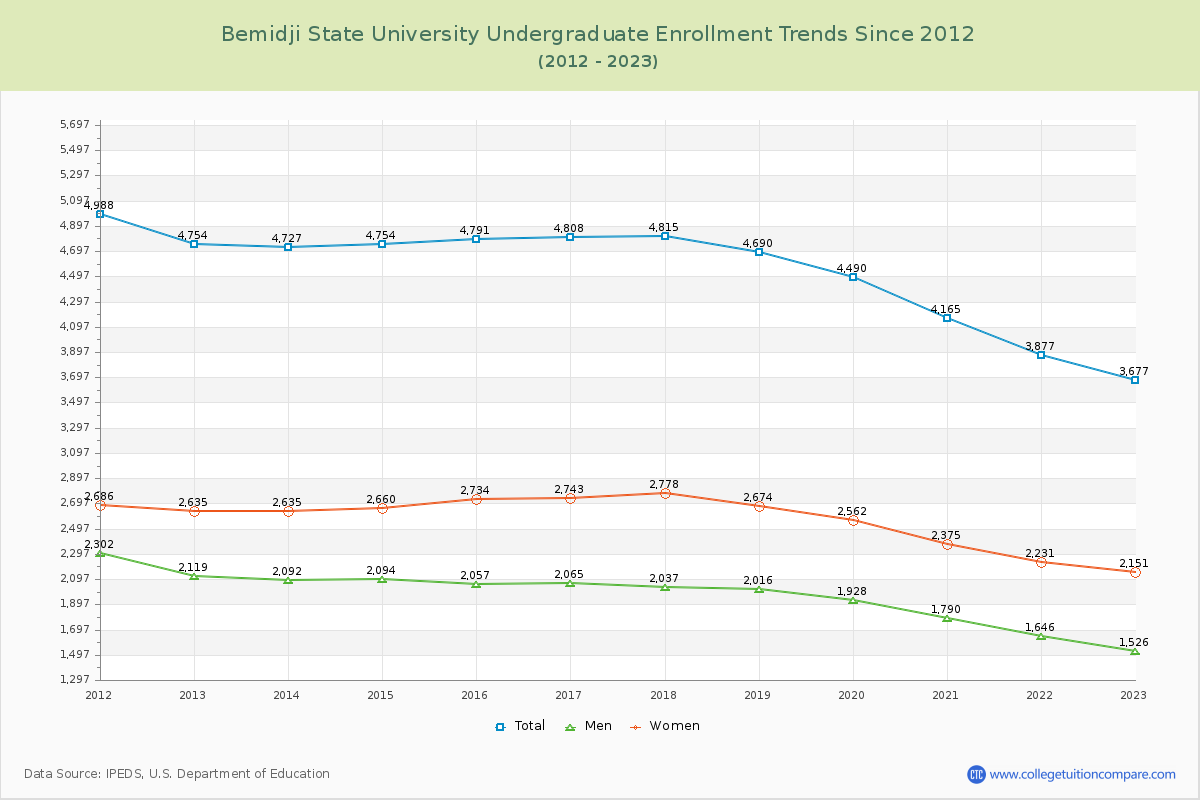
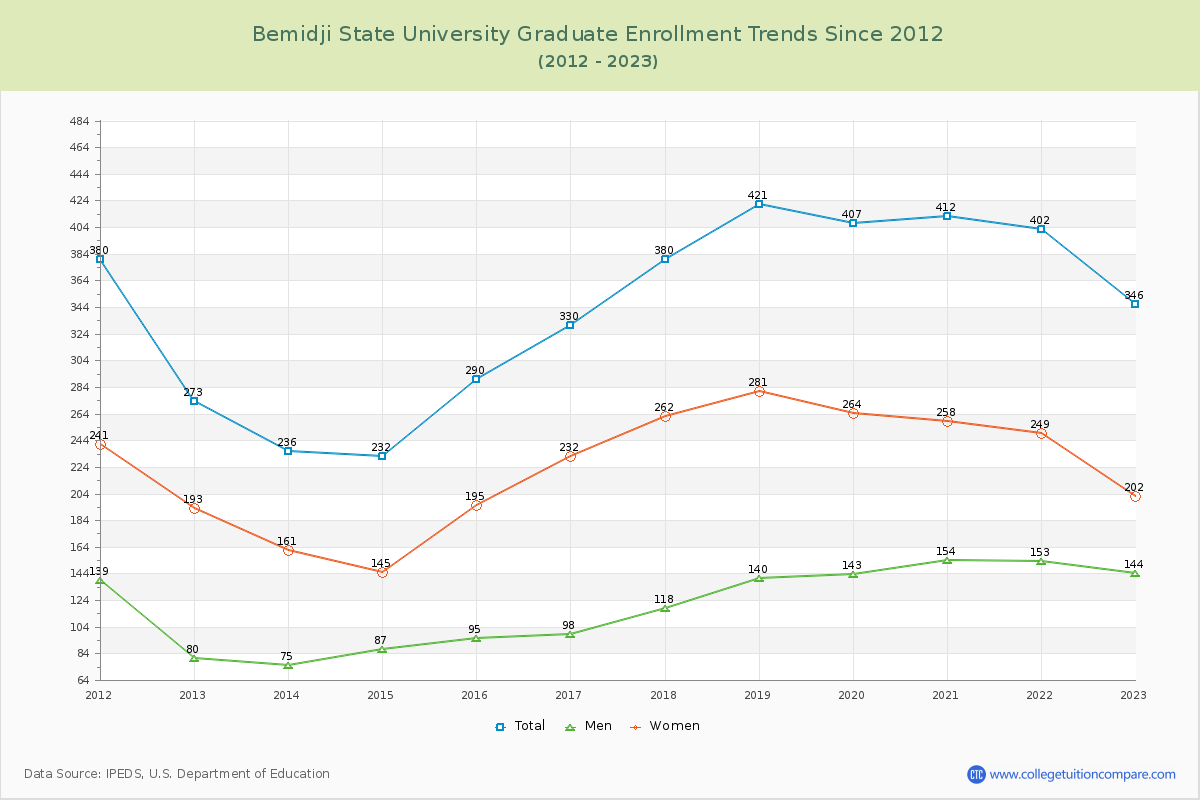
91.40% of total students is undergraduate students and 8.60% students is graduate students. The number of undergraduate students has decreased by 1,077 and the graduate enrollment has increased by 73 over past 10 years.
The female to male ratio is 1.41 to 1 and it means that there are more female students enrolled in Bemidji State than male students.
The following table and chart illustrate the changes in student population by gender at Bemidji State University since 2012.
| Year | Total | Undergraduate | Graduate | ||||
|---|---|---|---|---|---|---|---|
| Total | Men | Women | Total | Men | Women | ||
| 2012-13 | 5,027 | 4,754 | 2,119 | 2,635 | 273 | 80 | 193 |
| 2013-14 | 4,963 -64 | 4,727 -27 | 2,092 -27 | 2,635 0 | 236 -37 | 75 -5 | 161 -32 |
| 2014-15 | 4,986 23 | 4,754 27 | 2,094 2 | 2,660 25 | 232 -4 | 87 12 | 145 -16 |
| 2015-16 | 5,081 95 | 4,791 37 | 2,057 -37 | 2,734 74 | 290 58 | 95 8 | 195 50 |
| 2016-17 | 5,138 57 | 4,808 17 | 2,065 8 | 2,743 9 | 330 40 | 98 3 | 232 37 |
| 2017-18 | 5,195 57 | 4,815 7 | 2,037 -28 | 2,778 35 | 380 50 | 118 20 | 262 30 |
| 2018-19 | 5,111 -84 | 4,690 -125 | 2,016 -21 | 2,674 -104 | 421 41 | 140 22 | 281 19 |
| 2019-20 | 4,897 -214 | 4,490 -200 | 1,928 -88 | 2,562 -112 | 407 -14 | 143 3 | 264 -17 |
| 2020-21 | 4,577 -320 | 4,165 -325 | 1,790 -138 | 2,375 -187 | 412 5 | 154 11 | 258 -6 |
| 2021-22 | 4,279 -298 | 3,877 -288 | 1,646 -144 | 2,231 -144 | 402 -10 | 153 -1 | 249 -9 |
| 2022-23 | 4,023 -256 | 3,677 -200 | 1,526 -120 | 2,151 -80 | 346 -56 | 144 -9 | 202 -47 |
| Average | 4,843 | 4,504 | 1,943 | 2,562 | 339 | 117 | 222 |