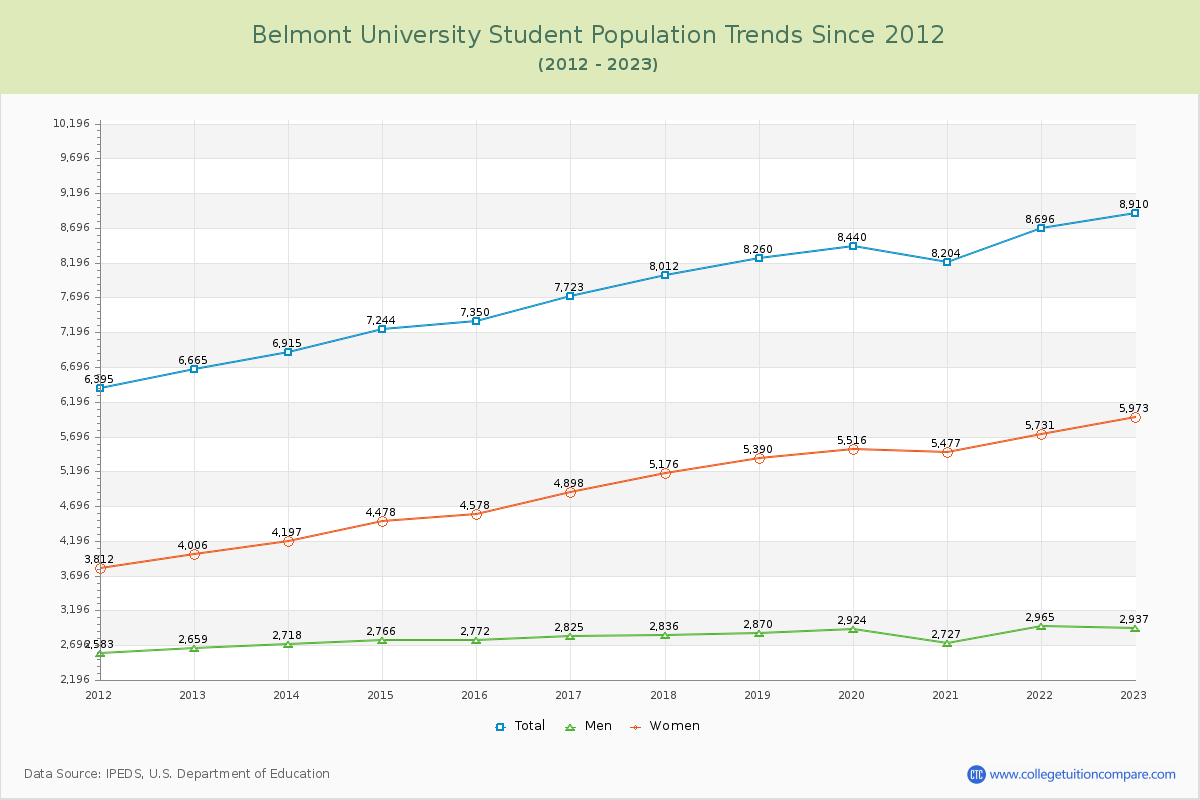
Student Population Changes
The average student population over the last 12 years is 7,856 where 8,910 students are attending the school for the academic year 2022-2023.
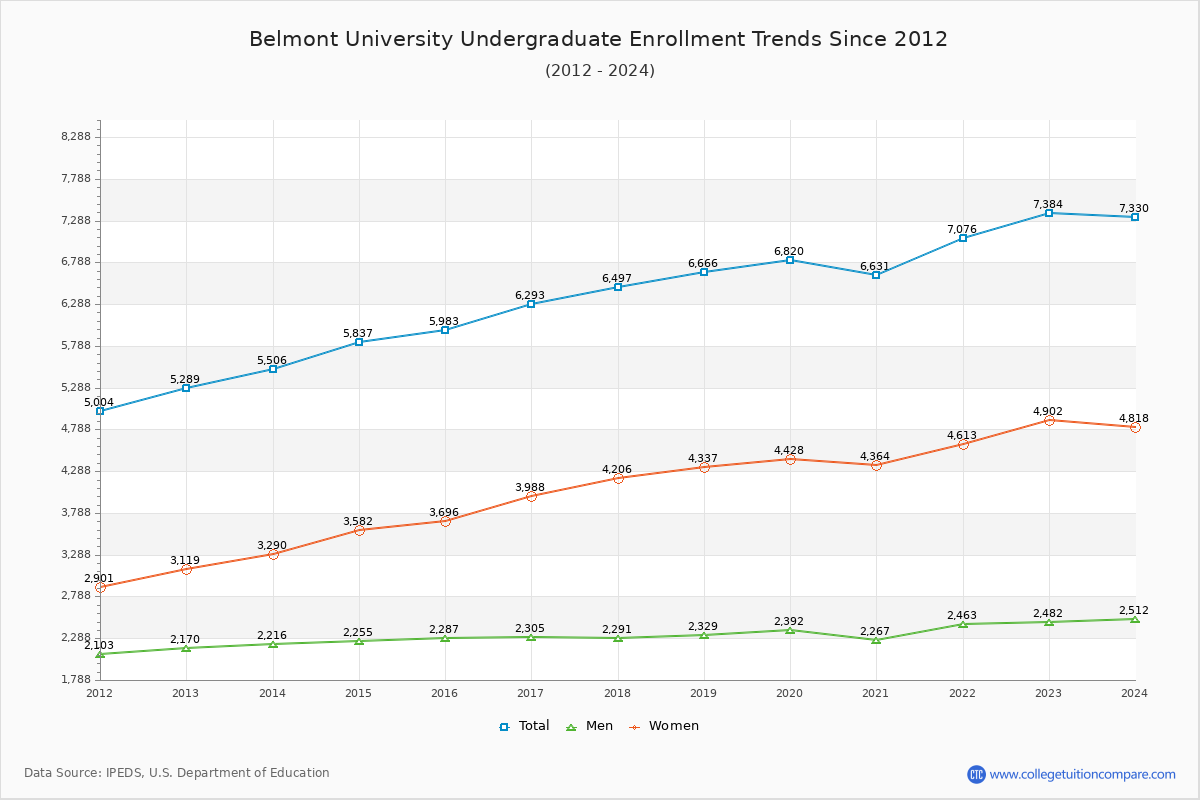
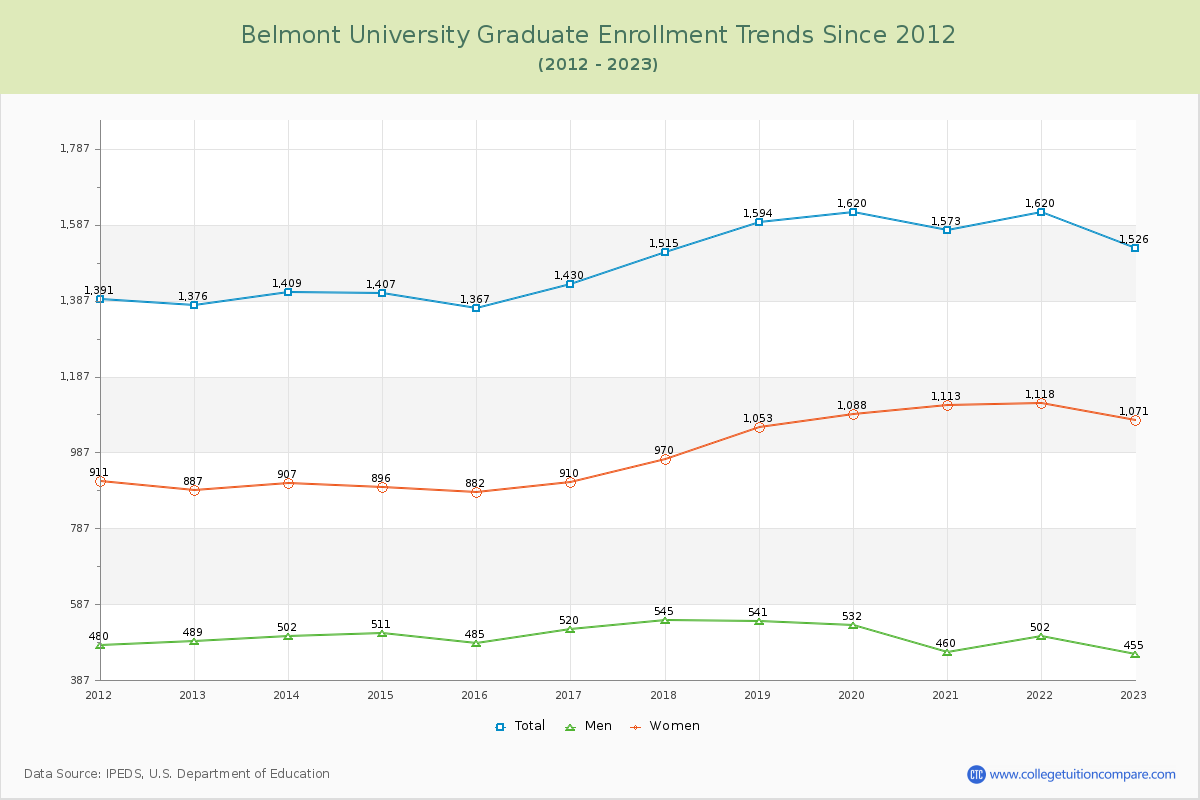
82.87% of total students is undergraduate students and 17.13% students is graduate students. The number of undergraduate students has increased by 2,095 and the graduate enrollment has increased by 150 over past 10 years.
The female to male ratio is 2.03 to 1 and it means that there are far more female students enrolled in Belmont than male students.
The following table and chart illustrate the changes in student population by gender at Belmont University since 2012.
| Year | Total | Undergraduate | Graduate | ||||
|---|---|---|---|---|---|---|---|
| Total | Men | Women | Total | Men | Women | ||
| 2012-13 | 6,665 | 5,289 | 2,170 | 3,119 | 1,376 | 489 | 887 |
| 2013-14 | 6,915 250 | 5,506 217 | 2,216 46 | 3,290 171 | 1,409 33 | 502 13 | 907 20 |
| 2014-15 | 7,244 329 | 5,837 331 | 2,255 39 | 3,582 292 | 1,407 -2 | 511 9 | 896 -11 |
| 2015-16 | 7,350 106 | 5,983 146 | 2,287 32 | 3,696 114 | 1,367 -40 | 485 -26 | 882 -14 |
| 2016-17 | 7,723 373 | 6,293 310 | 2,305 18 | 3,988 292 | 1,430 63 | 520 35 | 910 28 |
| 2017-18 | 8,012 289 | 6,497 204 | 2,291 -14 | 4,206 218 | 1,515 85 | 545 25 | 970 60 |
| 2018-19 | 8,260 248 | 6,666 169 | 2,329 38 | 4,337 131 | 1,594 79 | 541 -4 | 1,053 83 |
| 2019-20 | 8,440 180 | 6,820 154 | 2,392 63 | 4,428 91 | 1,620 26 | 532 -9 | 1,088 35 |
| 2020-21 | 8,204 -236 | 6,631 -189 | 2,267 -125 | 4,364 -64 | 1,573 -47 | 460 -72 | 1,113 25 |
| 2021-22 | 8,696 492 | 7,076 445 | 2,463 196 | 4,613 249 | 1,620 47 | 502 42 | 1,118 5 |
| 2022-23 | 8,910 214 | 7,384 308 | 2,482 19 | 4,902 289 | 1,526 -94 | 455 -47 | 1,071 -47 |
| Average | 7,856 | 6,362 | 2,314 | 4,048 | 1,494 | 504 | 990 |