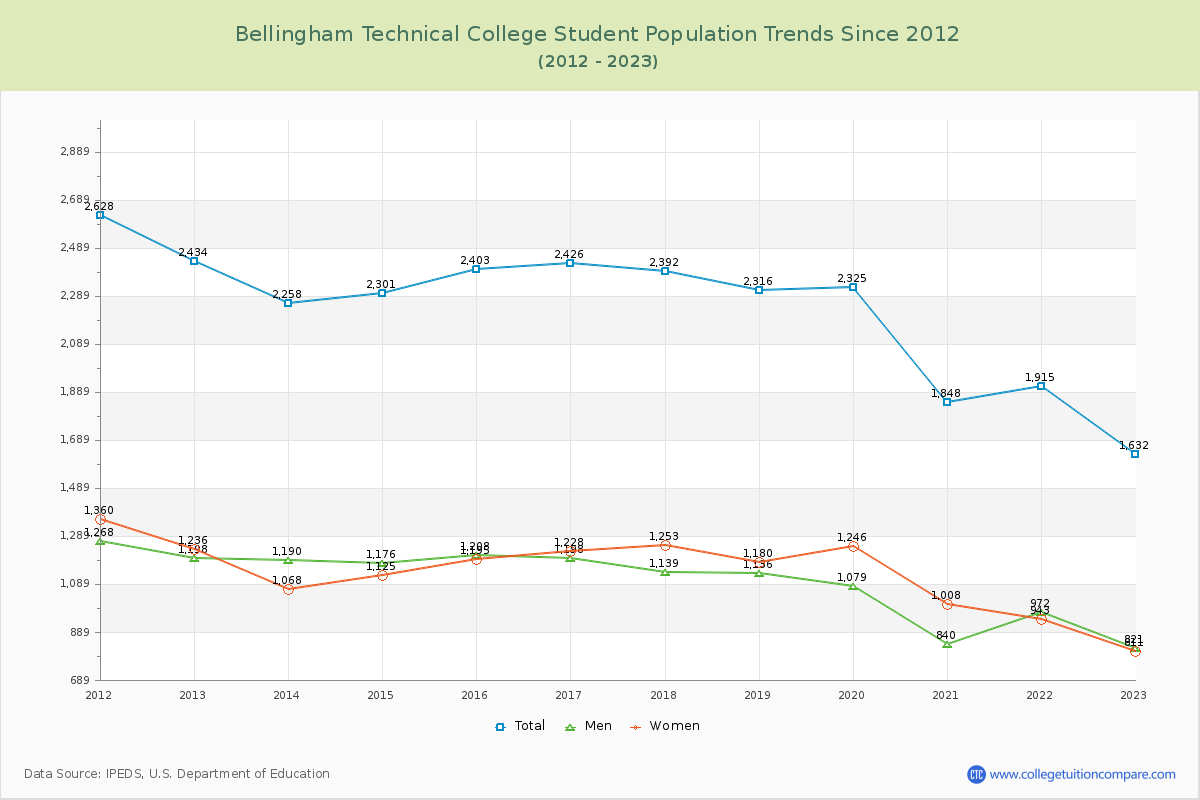
Student Population Changes
The average student population over the last 12 years is 2,205 where 1,632 students are attending the school for the academic year 2022-2023.
The female to male ratio is 0.99 to 1 and it means that there are similar numbers of female and male students enrolled in Bellingham Technical.
The following table and chart illustrate the changes in student population by gender at Bellingham Technical College since 2012.
| Year | Total | Men | Women |
|---|---|---|---|
| 2012-13 | 2,434 | 1,198 | 1,236 |
| 2013-14 | 2,258 -176 | 1,190 -8 | 1,068 -168 |
| 2014-15 | 2,301 43 | 1,176 -14 | 1,125 57 |
| 2015-16 | 2,403 102 | 1,208 32 | 1,195 70 |
| 2016-17 | 2,426 23 | 1,198 -10 | 1,228 33 |
| 2017-18 | 2,392 -34 | 1,139 -59 | 1,253 25 |
| 2018-19 | 2,316 -76 | 1,136 -3 | 1,180 -73 |
| 2019-20 | 2,325 9 | 1,079 -57 | 1,246 66 |
| 2020-21 | 1,848 -477 | 840 -239 | 1,008 -238 |
| 2021-22 | 1,915 67 | 972 132 | 943 -65 |
| 2022-23 | 1,632 -283 | 821 -151 | 811 -132 |
| Average | 2,205 | 1,087 | 1,118 |