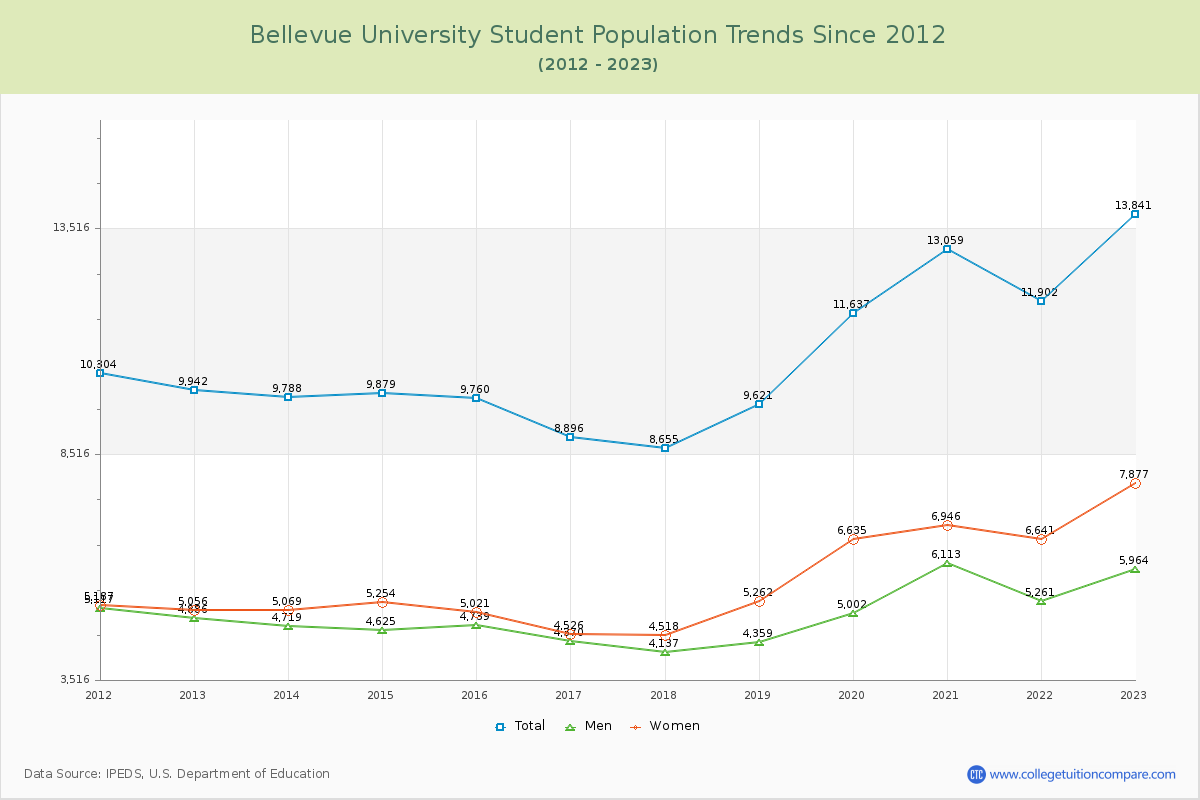
Student Population Changes
The average student population over the last 12 years is 10,635 where 13,841 students are attending the school for the academic year 2022-2023.
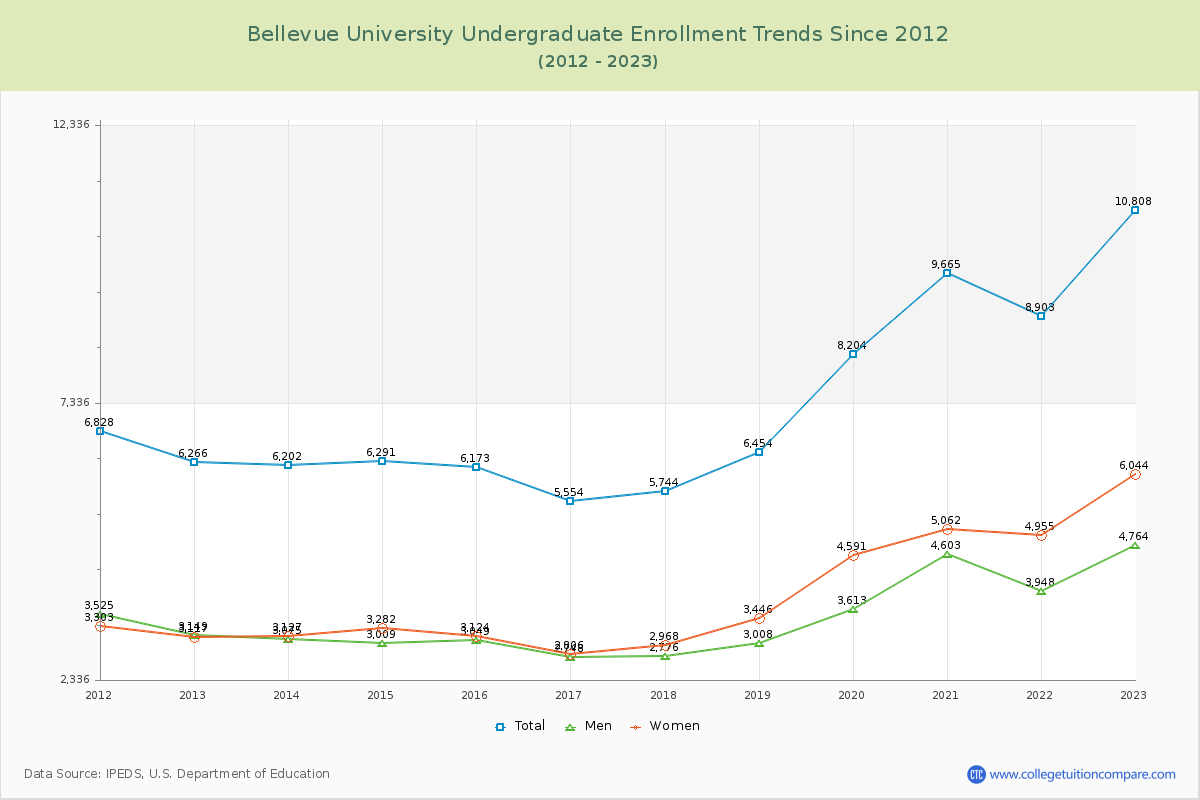
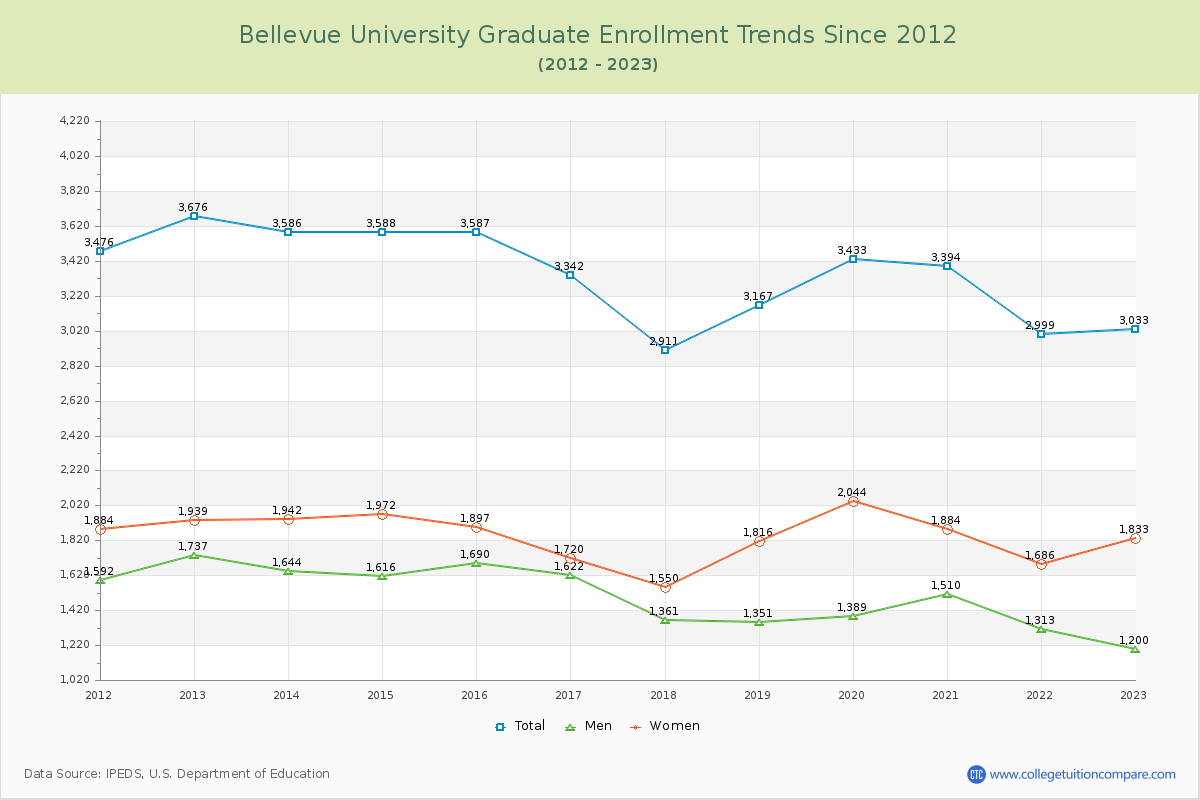
78.09% of total students is undergraduate students and 21.91% students is graduate students. The number of undergraduate students has increased by 4,542 and the graduate enrollment has decreased by 643 over past 10 years.
The female to male ratio is 1.32 to 1 and it means that there are more female students enrolled in Bellevue than male students.
The following table and chart illustrate the changes in student population by gender at Bellevue University since 2012.
| Year | Total | Undergraduate | Graduate | ||||
|---|---|---|---|---|---|---|---|
| Total | Men | Women | Total | Men | Women | ||
| 2012-13 | 9,942 | 6,266 | 3,149 | 3,117 | 3,676 | 1,737 | 1,939 |
| 2013-14 | 9,788 -154 | 6,202 -64 | 3,075 -74 | 3,127 10 | 3,586 -90 | 1,644 -93 | 1,942 3 |
| 2014-15 | 9,879 91 | 6,291 89 | 3,009 -66 | 3,282 155 | 3,588 2 | 1,616 -28 | 1,972 30 |
| 2015-16 | 9,760 -119 | 6,173 -118 | 3,049 40 | 3,124 -158 | 3,587 -1 | 1,690 74 | 1,897 -75 |
| 2016-17 | 8,896 -864 | 5,554 -619 | 2,748 -301 | 2,806 -318 | 3,342 -245 | 1,622 -68 | 1,720 -177 |
| 2017-18 | 8,655 -241 | 5,744 190 | 2,776 28 | 2,968 162 | 2,911 -431 | 1,361 -261 | 1,550 -170 |
| 2018-19 | 9,621 966 | 6,454 710 | 3,008 232 | 3,446 478 | 3,167 256 | 1,351 -10 | 1,816 266 |
| 2019-20 | 11,637 2,016 | 8,204 1,750 | 3,613 605 | 4,591 1,145 | 3,433 266 | 1,389 38 | 2,044 228 |
| 2020-21 | 13,059 1,422 | 9,665 1,461 | 4,603 990 | 5,062 471 | 3,394 -39 | 1,510 121 | 1,884 -160 |
| 2021-22 | 11,902 -1,157 | 8,903 -762 | 3,948 -655 | 4,955 -107 | 2,999 -395 | 1,313 -197 | 1,686 -198 |
| 2022-23 | 13,841 1,939 | 10,808 1,905 | 4,764 816 | 6,044 1,089 | 3,033 34 | 1,200 -113 | 1,833 147 |
| Average | 10,635 | 7,297 | 3,431 | 3,866 | 3,338 | 1,494 | 1,844 |